See also

 04.04.2025 07:29 AM
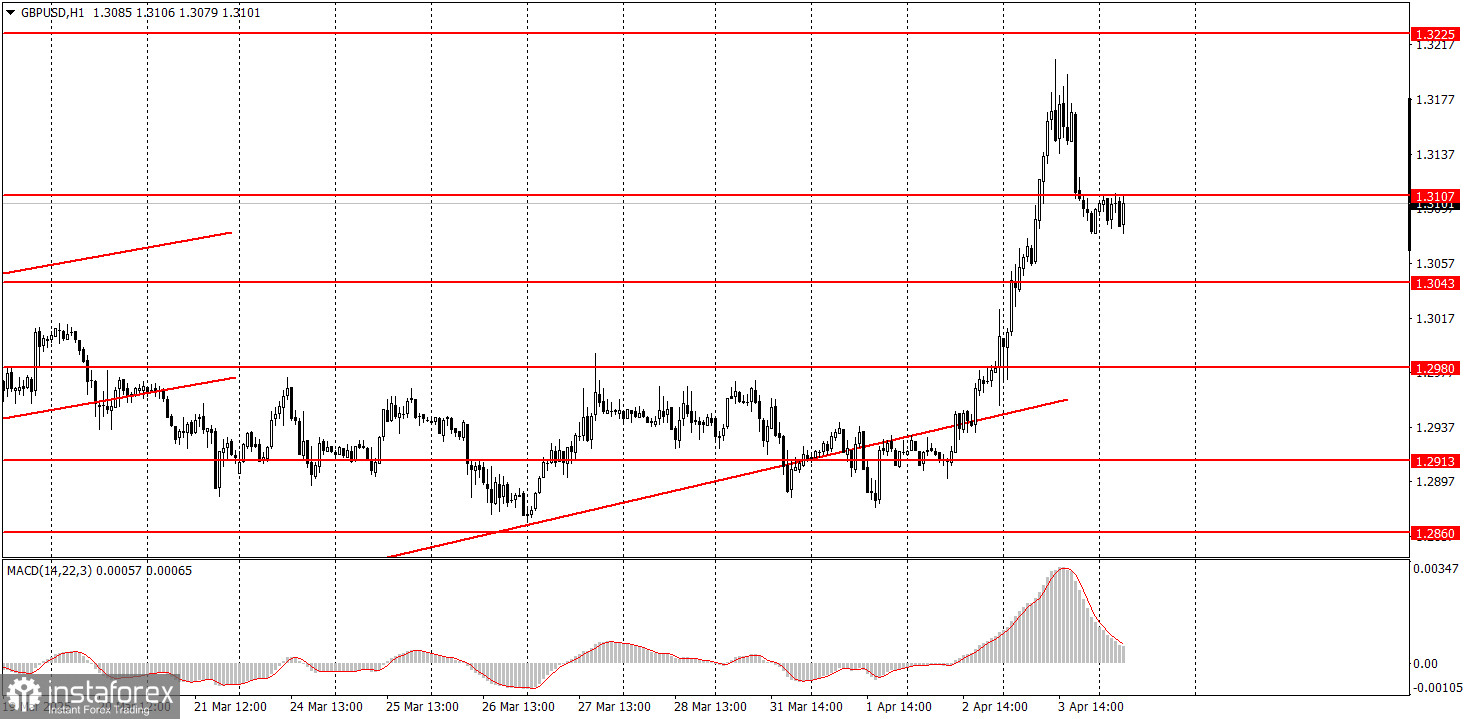
The GBP/USD pair also showed a strong upward movement on Thursday. Everything discussed in the EUR-related articles applies equally to the British pound. The sole reason for the pound's strong rally in recent months has been Donald Trump's new trade policy. There are simply no other reasons. Macroeconomic data from the UK continues to disappoint more often than it surprises positively, and the market is reacting solely to changes in the global trade system. We believe this is only the beginning of the trade war. Many countries worldwide are now expected to implement retaliatory tariffs, while Trump will escalate U.S. tariffs, which could go on indefinitely. The markets in 2025 may experience more than a few major shocks. Novice traders should understand that such movements, as we saw on Wednesday and Thursday, may become the norm this year. Therefore, it is always important to place a Stop Loss.
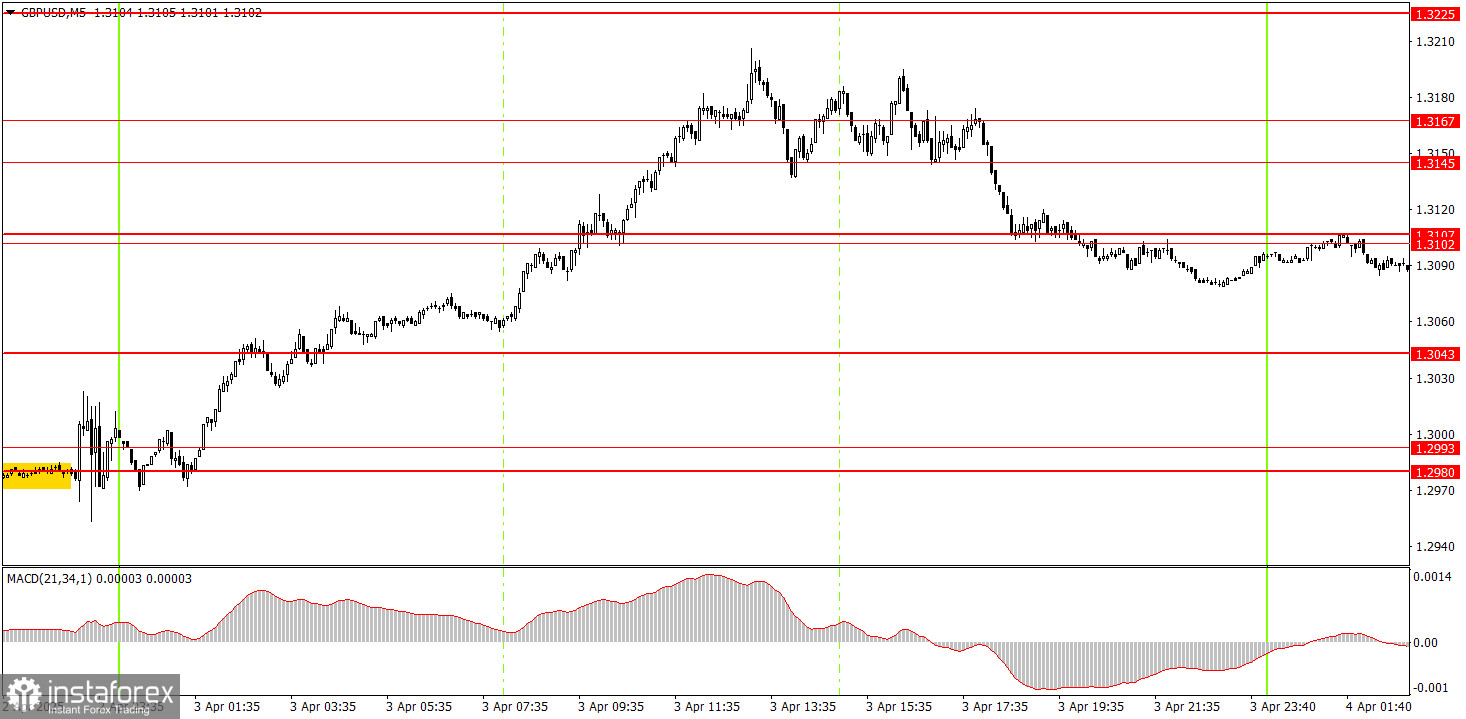
On the 5-minute timeframe, numerous buy signals were formed on Thursday. Any of them could have been traded. The size of the profit depended on what time you woke up, as the upward move lasted throughout Thursday night. It wasn't until late Thursday evening that the dollar's collapse ended—or paused. The upward movement may well continue today. Each trader must individually decide whether to engage in high volatility trading.
On the hourly timeframe, the GBP/USD pair should have started a downward trend long ago, but Trump continues doing everything possible to drive the dollar as low as possible. After the official start of the global trade war, we won't attempt to predict long-term pair movements. The best option right now is to trade on lower timeframes where trends and their changes can be monitored more quickly. However, we want to warn traders that the forex market is now under the control of politics. Countermeasures against the U.S. could also trigger significant market moves.
On Friday, the GBP/USD pair could easily continue to rise—mainly if Powell's speech contains even the slightest dovish tone and U.S. data fall short of forecasts. We had assumed the market was done pricing in all of Trump's tariffs and had lost interest in the topic, but the U.S. president has once again managed to shock the markets.
On the 5-minute chart, trading can now be done based on the levels: 1.2502–1.2508, 1.2547, 1.2613, 1.2680–1.2685, 1.2723, 1.2791–1.2798, 1.2848–1.2860, 1.2913, 1.2980–1.2993, 1.3043, 1.3102–1.3107, 1.3145–1.3167, 1.3225, and 1.3272. No notable events are scheduled in the UK for Friday, while in the U.S., we await a speech by the Fed Chair—who will likely comment on the new tariffs—as well as labor market and unemployment reports. The storm continues.
Support and Resistance Levels: These are target levels for opening or closing positions and can also serve as points for placing Take Profit orders.
Red Lines: Channels or trendlines indicating the current trend and the preferred direction for trading.
MACD Indicator (14,22,3): A histogram and signal line used as a supplementary source of trading signals.
Important Events and Reports: Found in the economic calendar, these can heavily influence price movements. Exercise caution or exit the market during their release to avoid sharp reversals.
Forex trading beginners should remember that not every trade will be profitable. Developing a clear strategy and practicing proper money management are essential for long-term trading success.


