empty
04.04.2025 10:32 AM
EUR/USD. April 4th. The Trade Conflict Is Only Gaining Momentum

On Thursday, the EUR/USD pair continued its upward movement. At the moment, the decline in the U.S. dollar has paused, but the market could "explode" again at any moment. A bounce from the 161.8% Fibonacci retracement level at 1.1094 may signal a reversal in favor of the U.S. dollar and a decline toward the 127.2% and 100.0% levels. A breakout and consolidation above 1.1094 would increase the chances of continued growth toward the next Fibonacci level at 200.0% – 1.1179.

This image is no longer relevant

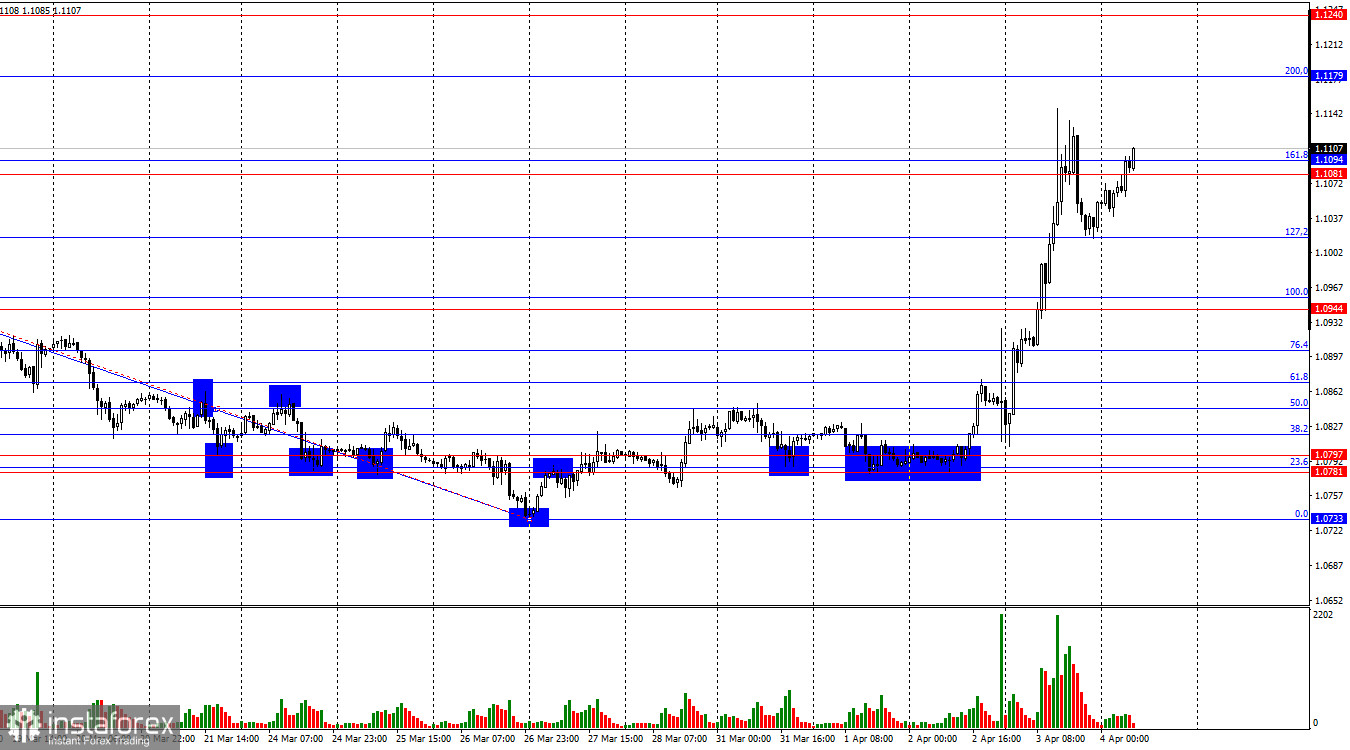
The last completed downward wave broke the low of the previous wave, but the latest upward wave also broke the prior high. This currently points to a bullish trend reversal. Donald Trump imposed new tariffs last week, and this week he extended tariffs to all goods from all countries globally. Bulls had been showing weakness recently, but as it turned out yesterday, that weakness was simply a period of waiting.

The news background on Thursday revolved solely around Trump's global tariffs. The generosity of the U.S. president is, indeed, striking. If tariffs against Nicaragua or Serbia are of little concern to traders, a 54% duty on Chinese imports is a major issue, given the enormous trade volume between the U.S. and China. Trump also hasn't forgotten the European Union. Previous tariffs on EU cars, steel, and aluminum were considered "general" tariffs. Now, an additional 10% has been added, meaning EU imports will now face a total "tax" of 20%. In both Beijing and Brussels, retaliatory measures are being prepared—which could further enrage Trump. He has repeatedly warned that any country daring to retaliate will face even greater tariff pressure. As such, next week may bring a flood of new information that could shake the charts in highly unexpected ways.

This image is no longer relevant

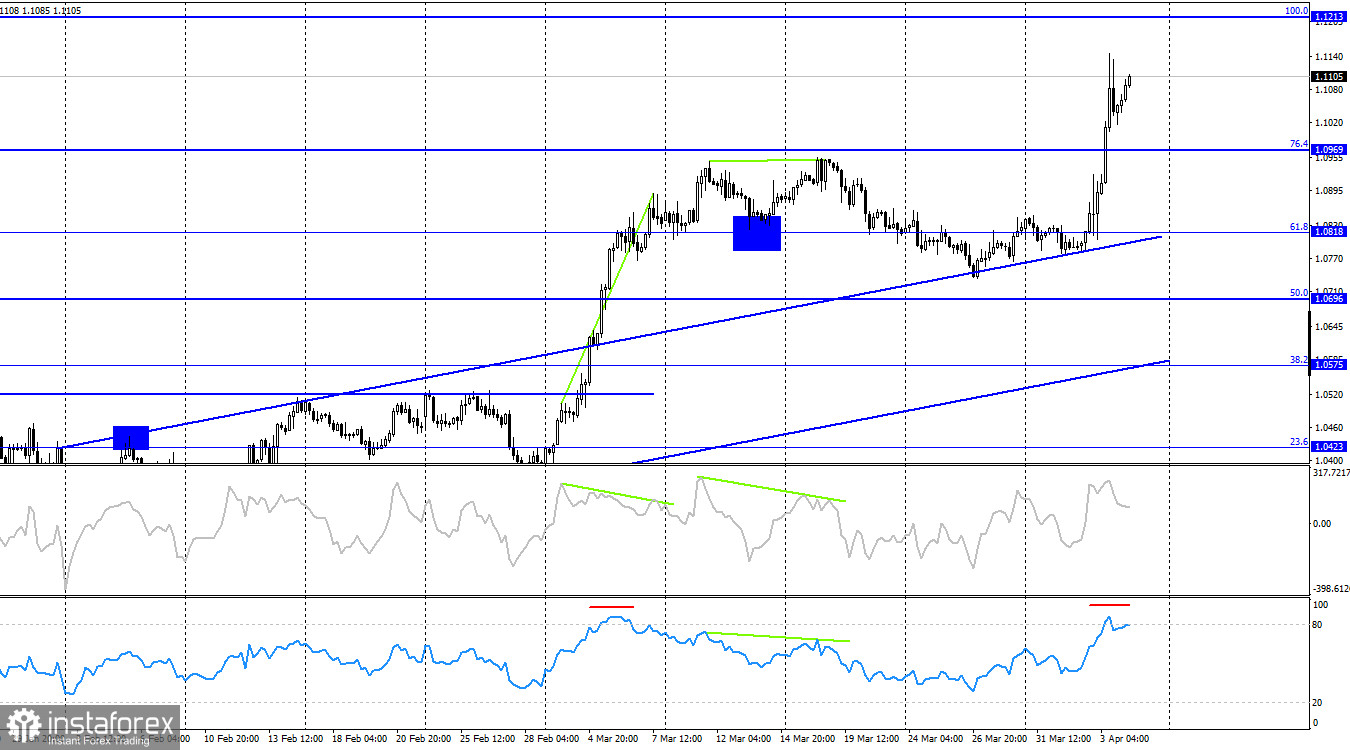
On the 4-hour chart, the pair has made a new upward reversal in favor of the euro and consolidated above the 76.4% Fibonacci retracement level at 1.0969. The euro's growth, unsupported by EU economic data, should have ended long ago—but Trump continues to exert intense pressure on the dollar. A close above 1.0969 supports a continuation of the rally toward the 100.0% Fibonacci level at 1.1213. The RSI is overbought, but right now, the fundamental background outweighs technicals.

Commitments of Traders (COT) Report:

This image is no longer relevant

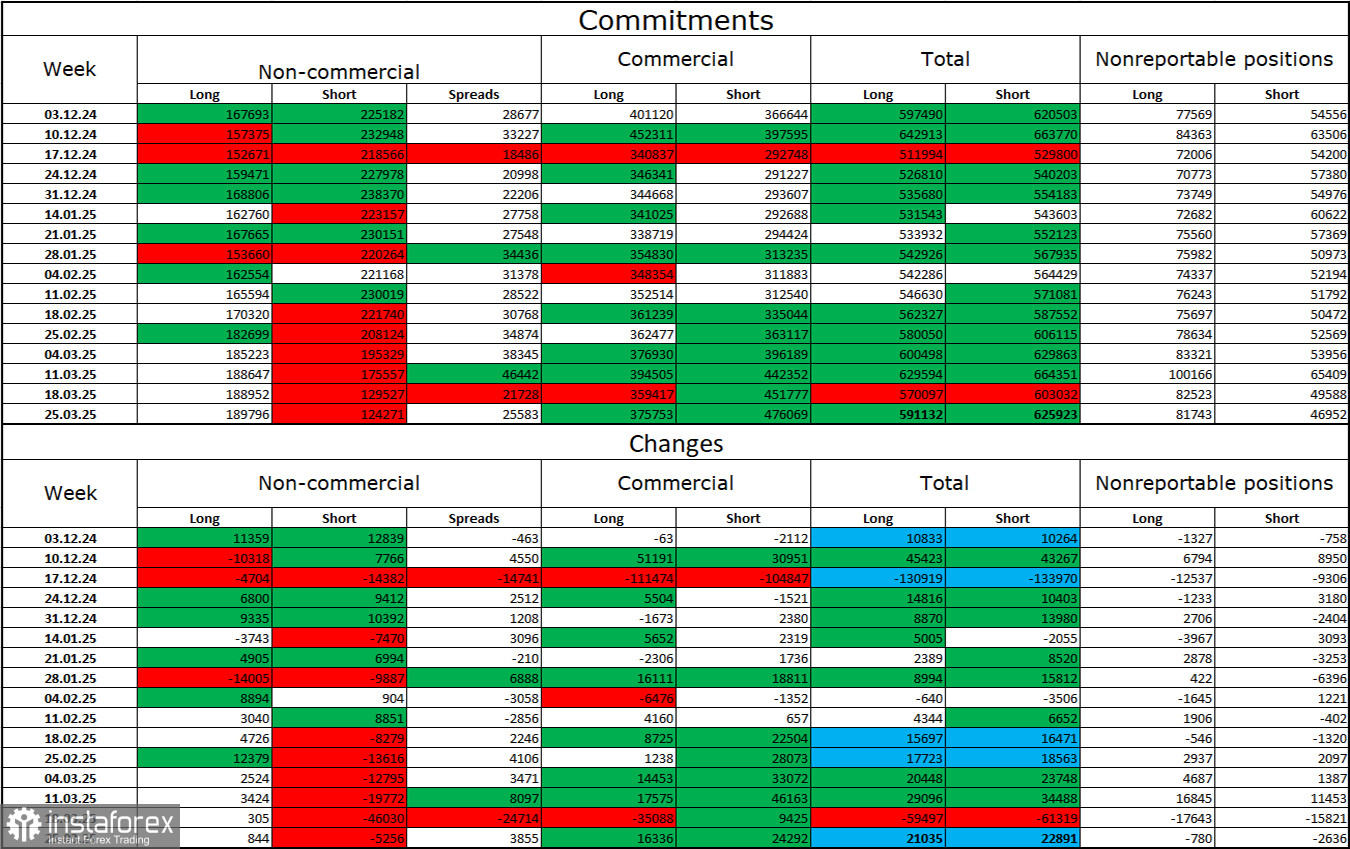
In the most recent reporting week, professional traders opened 844 long positions and closed 5,256 short positions. The sentiment of the "Non-commercial" group has once again turned bullish—thanks to Donald Trump. The total number of long positions held by speculators now stands at 190,000, while short positions total 124,000.

For twenty consecutive weeks, large players had been selling off the euro, but for the last seven weeks, they've been reducing short positions and building up longs. Despite the interest rate differential still favoring the U.S. dollar due to divergent monetary policies between the ECB and the Fed, Trump's trade policy has become the dominant factor. It could pressure the FOMC into a more dovish stance and potentially trigger a U.S. recession.

Economic Calendar for the U.S. and Eurozone (April 4):

  • U.S. – Nonfarm Payrolls (12:30 UTC)
  • U.S. – Unemployment Rate (12:30 UTC)
  • U.S. – Average Hourly Earnings (12:30 UTC)
  • U.S. – Speech by Fed Chair Jerome Powell (15:25 UTC)

April 4 features three key events on the economic calendar, but whether the market even cares about them right now is questionable. Market sentiment on Friday is expected to be driven more by Trump's policies than by hard U.S. data.

EUR/USD Forecast and Trading Tips:

Selling the pair is possible today if there is a confirmed rebound from the 1.1094 level on the hourly chart, with a target of 1.1017.

Buying opportunities will open if the pair closes above 1.1094 on the hourly chart, targeting 1.1179.

Fibonacci levels are drawn from 1.0957–1.0733 on the hourly chart and 1.1214–1.0179 on the 4-hour chart.

Samir Klishi,
Analytical expert of InstaTrade
© 2007-2025

Recommended Stories

Forecast for EUR/USD on June 10, 2025

On Monday, the EUR/USD pair traded sideways between the levels of 1.1380 and 1.1454, forming a range. Therefore, a rebound from the support zone of 1.1374–1.1380 would favor the euro

Samir Klishi 10:33 2025-06-10 UTC+2

GBP/USD. June 10th. Unemployment Rises in the UK

On the hourly chart, the GBP/USD pair on Monday made two rebounds from the 161.8% corrective level at 1.3520 but failed to start an upward movement. Today, on Tuesday

Samir Klishi 10:21 2025-06-10 UTC+2

Technical Analysis of Intraday Price Movement of EUR/USD Main Currency Pairs, Tuesday June 10 2025.

With the appearance of the Ascending Broadening Wedge pattern followed by the appearance of the Bearish 123 pattern, it gives an indication that in the near future EUR/USD

Arief Makmur 05:59 2025-06-10 UTC+2

Technical Analysis of Intraday Price Movement of GBP/JPY Cross Currency Pairs, Tuesday June 10, 2025.

On the 4-hour chart of the GBP/JPY cross currency pair, there are several interesting things can be seen. First, the price movement is moving above the WMA (21) which

Arief Makmur 05:59 2025-06-10 UTC+2

Forecast for EUR/USD on June 10, 2025

Monday passed calmly in the markets, and the main takeaway was the restoration of risk-related correlations. The euro bounced back from the daily MACD line support for the second consecutive

Laurie Bailey 04:52 2025-06-10 UTC+2

Forecast for GBP/USD on June 10, 2025

On Monday, the British pound closed with a small gain. This pattern has become common over the past week—growth marked by small white candles, while declines occur through extended black

Laurie Bailey 04:48 2025-06-10 UTC+2

AUD/USD Forecast for June 10, 2025

The Australian dollar has shown moderate growth of more than a figure over the past 10 days, but the Marlin oscillator's reluctance to follow this upward move is causing concern

Laurie Bailey 04:46 2025-06-10 UTC+2

Trading Signals for GOLD (XAU/USD) for June 9-12, 2025: sell below $3,350 (21 SMA - 7/8 Murray)

Early in the American session, gold is trading around 3,317, rebounding after reaching a low of 3,294 during the European session. On the H4 chart, gold could continue to rise

Dimitrios Zappas 15:23 2025-06-09 UTC+2

Trading Signals for EUR/USD for June 9-12, 2025: sell below 1.1415 (21 SMA - 6/8 Murray)

We believe the euro could continue to fall as a bearish continuation pattern is forming, but we should expect it to fall below 1.1400, which could then reach the bottom

Dimitrios Zappas 15:20 2025-06-09 UTC+2

EUR/USD. Analysis and Forecast

Today, the EUR/USD pair is attracting buyers, recovering part of Friday's losses amid a weaker U.S. dollar. From a technical perspective, the EUR/USD pair is currently showing resilience below

Irina Yanina 13:57 2025-06-09 UTC+2
Can't speak right now?
Ask your question in the chat.
 

Dear visitor,

Your IP address shows that you are currently located in the USA. If you are a resident of the United States, you are prohibited from using the services of InstaFintech Group including online trading, online transfers, deposit/withdrawal of funds, etc.

If you think you are seeing this message by mistake and your location is not the US, kindly proceed to the website. Otherwise, you must leave the website in order to comply with government restrictions.

Why does your IP address show your location as the USA?

  • - you are using a VPN provided by a hosting company based in the United States;
  • - your IP does not have proper WHOIS records;
  • - an error occurred in the WHOIS geolocation database.

Please confirm whether you are a US resident or not by clicking the relevant button below. If you choose the wrong option, being a US resident, you will not be able to open an account with InstaTrade anyway.

We are sorry for any inconvenience caused by this message.