empty
10.04.2025 12:19 PM
EUR/USD. April 10. Trump Continues to Shake the Markets

On Wednesday, the EUR/USD pair made two rebounds from the resistance zone of 1.1081–1.1095, turned in favor of the U.S. dollar, and declined toward the support zone of 1.0944–1.0957. A rebound from this zone will favor the euro and could trigger a resumption of growth toward the 1.1081–1.1095 level. For now, I do not anticipate a deeper decline, although much depends on the informational background, which, thanks to Trump, remains highly volatile.

This image is no longer relevant

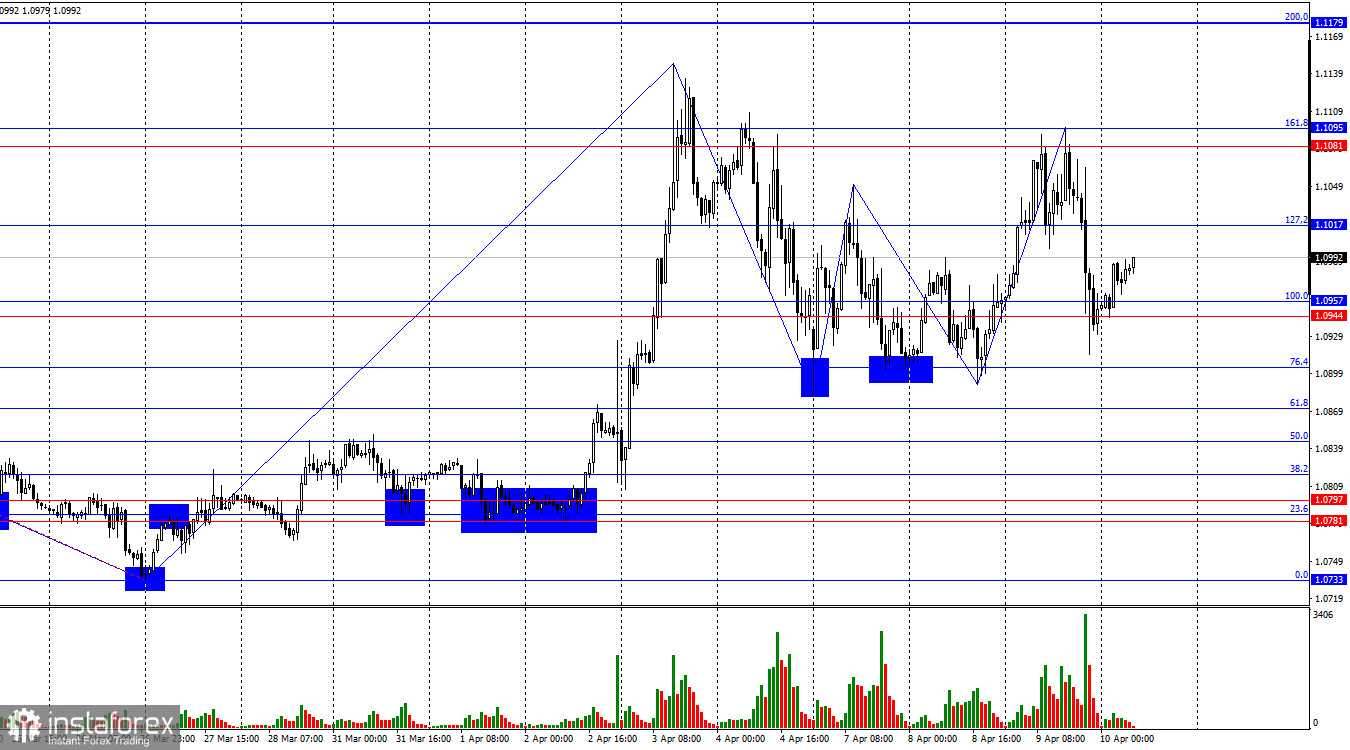
The wave pattern on the hourly chart has changed. The last completed downward wave did not break the previous low, while the new upward wave broke the previous peak. Therefore, the waves now suggest a reversal to a bullish trend. Donald Trump continues to impose new import tariffs, and panic and chaos persist in the markets. Bulls became more active again last week, but at the moment, it is hard to say who truly has the initiative—conditions are changing too rapidly.

The news background on Wednesday again had a direct impact on trader sentiment. There was a flood of headlines, and traders at times didn't know what to react to. First, Donald Trump raised tariffs on Chinese imports to 125% in response to China's decision to raise tariffs on U.S. goods to 84%. Later in the evening, it was announced that Trump decided to implement a three-month negotiation pause for all countries except China. The pause is mostly symbolic, as tariffs will still remain in effect, albeit at a reduced "preferential" rate of 10%. For the dollar, which has lacked positive news lately, even this development was welcomed. Still, the bears were unable to mount sustained pressure, as the broader situation remains unchanged. Trump's goodwill on Wednesday evening does not mean the trade war is over, nor that peace and friendship have been restored. Knowing Trump, he could cancel the preferential period and raise all tariffs again as soon as next week.

This image is no longer relevant

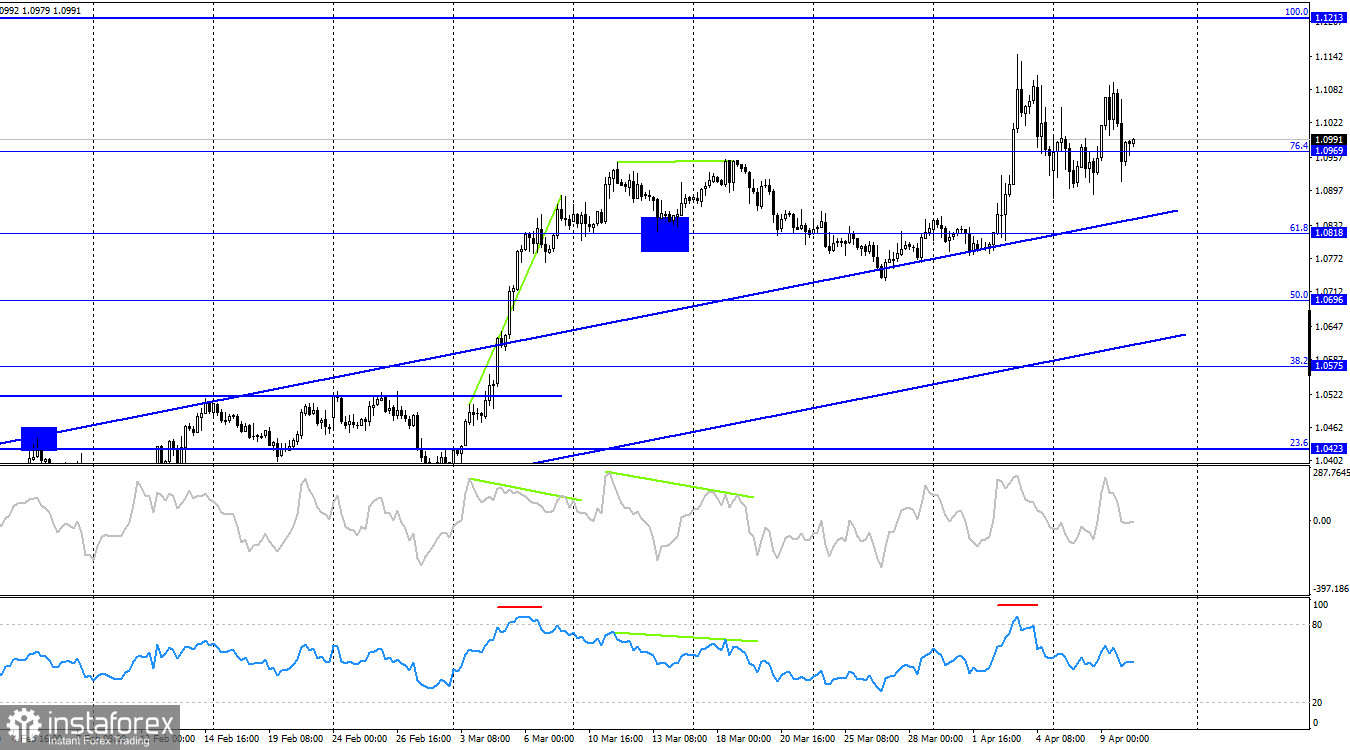
On the 4-hour chart, the pair reversed in favor of the U.S. dollar, but the future direction will depend on how global events unfold. The trade war, in the full sense of the term, has only just begun. Therefore, I cannot base expectations for the pair's growth or decline solely on existing information. Market movements will be dictated exclusively by the incoming news flow. However, the bullish trend remains intact.

Commitments of Traders (COT) Report:

This image is no longer relevant

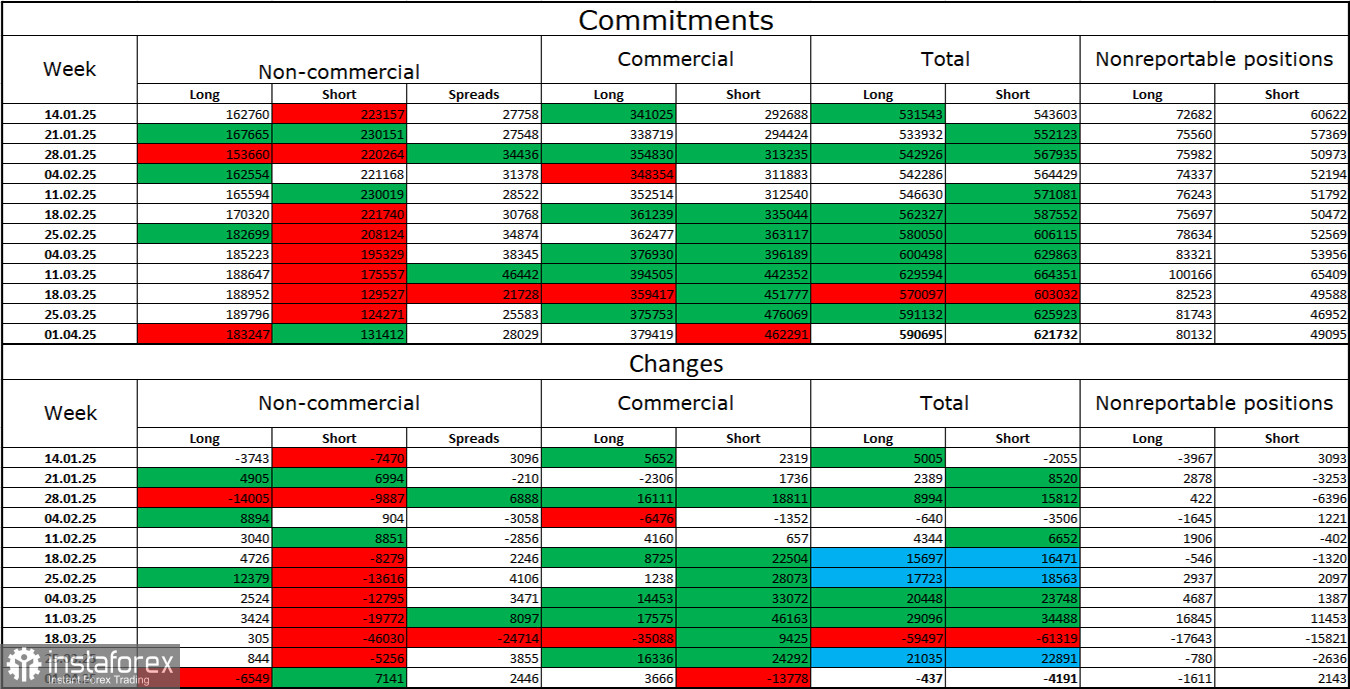
Over the past reporting week, professional traders closed 6,549 long positions and opened 7,141 short positions. Sentiment in the "Non-commercial" category has recently turned bullish again—thanks to Donald Trump. The total number of long positions held by speculators now stands at 183,000, while short positions are at 131,000.

For twenty consecutive weeks, large players had been selling off the euro, but now for eight weeks straight, they have been reducing short positions and increasing long ones. The divergence in monetary policy approaches between the ECB and the Fed continues to support the U.S. dollar, but Trump's policy has become a more significant factor for traders, as it may exert dovish pressure on the Fed's stance and even trigger a recession in the U.S. economy.

Economic Calendar for the U.S. and the EU:

  • U.S. – Consumer Price Index (12:30 UTC)
  • U.S. – Initial Jobless Claims (12:30 UTC)

On April 10, the economic calendar includes two U.S. reports, one of which is relatively important. Thus, the informational background may strongly influence market sentiment on Thursday, but any news about tariffs will remain the primary driver. On Wednesday, China announced an 84% tariff on imports from the U.S., and the U.S. responded with a 125% hike. Tensions continue to escalate.

EUR/USD Forecast and Trading Tips:

Consider buying or selling the pair today only if clear signals appear near key levels on the hourly chart. However, I would once again emphasize that movements will depend more on the news cycle than on chart patterns.

Fibonacci levels are drawn from 1.0957–1.0733 on the hourly chart and from 1.1214–1.0179 on the 4-hour chart.

Samir Klishi,
Analytical expert of InstaTrade
© 2007-2025

Recommended Stories

EUR/USD. July 3rd. The Most Important Day of the Week

On Wednesday, the EUR/USD pair rebounded from the 1.1802 level, reversed in favor of the U.S. dollar, and showed a slight decline. However, by Thursday morning, the pair had returned

Samir Klishi 12:10 2025-07-03 UTC+2

GBP/USD. The Sterling May Stop Receiving Support

As previously mentioned on multiple occasions, the strength of the major currencies traded against the U.S. dollar on the foreign exchange (Forex) market was based solely on the fundamental weakness

Pati Gani 11:27 2025-07-03 UTC+2

Forex forecast 03/07/2025: EUR/USD, USD/JPY, GBP/USD, SP500, Gold and Bitcoin

Useful links: My other articles are available in this section InstaForex course for beginners Popular Analytics Open trading account Important: The begginers in forex trading need to be very careful

Sebastian Seliga 10:57 2025-07-03 UTC+2

Forecast for GBP/USD on July 3, 2025

On the hourly chart, the GBP/USD pair on Wednesday rebounded from the 200.0% retracement level at 1.3749, reversed in favor of the U.S. dollar, and fell below the support zone

Samir Klishi 10:03 2025-07-03 UTC+2

If Crude Oil manages to break below the Pivot level, it has the potential to test its nearest Support level, Thursday, July 03, 2025.

Crude Oil, Thursday, July 03, 2025. Poor global economic conditions such as the stagnation of Chinese & European manufacturing have triggered concerns about global Crude Oil demand and expectations

Arief Makmur 07:36 2025-07-03 UTC+2

The Nasdaq 100 index has the potential to test its closest Resistance level, Thursday, July 03, 2025.

Nasdaq 100 Index, Thursday, July 03, 2025. Positive Big Tech Company financial reports and the increasingly strong rumors of the Fed's Dovish policy and the rise of AI innovation have

Arief Makmur 07:36 2025-07-03 UTC+2

EUR/AUD Forecast for July 3, 2025

On the daily chart, the EUR/AUD pair is moving sideways in the upper half of the price channel and above the MACD indicator line. The signal line of the Marlin

Laurie Bailey 06:33 2025-07-03 UTC+2

EUR/USD Forecast for July 3, 2025

Ahead of today's U.S. employment data release for June, the euro consolidated near the price channel line on the daily chart. The long lower shadow of the candlestick suggests that

Laurie Bailey 05:11 2025-07-03 UTC+2

GBP/USD Forecast for July 3, 2025

By the end of yesterday, the British pound had lost 108 pips. Although the reason was not the anticipation of today's U.S. employment data, but rather domestic political turmoil, this

Laurie Bailey 05:11 2025-07-03 UTC+2

Silver Forecast for July 3, 2025

After two days of intense struggle (Monday and Tuesday) between the bulls and bears along the price channel line amid heightened volatility, yesterday we saw the outcome — the bulls

Laurie Bailey 05:11 2025-07-03 UTC+2
Can't speak right now?
Ask your question in the chat.
 

Dear visitor,

Your IP address shows that you are currently located in the USA. If you are a resident of the United States, you are prohibited from using the services of InstaFintech Group including online trading, online transfers, deposit/withdrawal of funds, etc.

If you think you are seeing this message by mistake and your location is not the US, kindly proceed to the website. Otherwise, you must leave the website in order to comply with government restrictions.

Why does your IP address show your location as the USA?

  • - you are using a VPN provided by a hosting company based in the United States;
  • - your IP does not have proper WHOIS records;
  • - an error occurred in the WHOIS geolocation database.

Please confirm whether you are a US resident or not by clicking the relevant button below. If you choose the wrong option, being a US resident, you will not be able to open an account with InstaTrade anyway.

We are sorry for any inconvenience caused by this message.