See also

 07.05.2025 07:36 PM
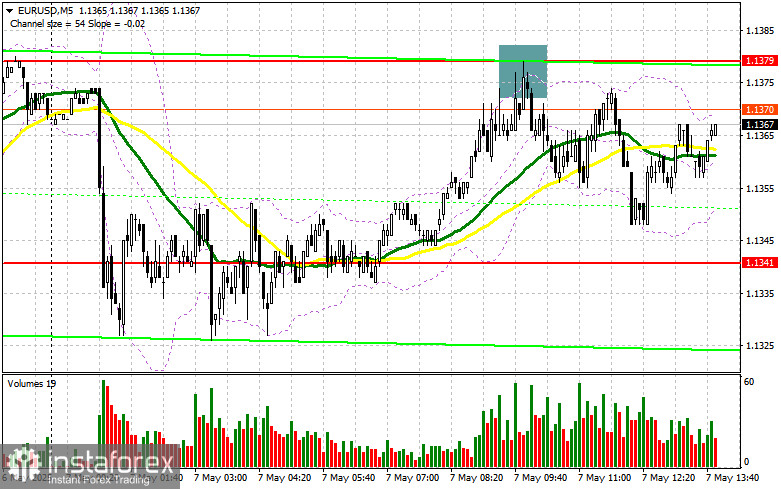
In my morning forecast, I highlighted the 1.1379 level and planned to base market entry decisions around it. Let's look at the 5-minute chart to understand what happened. A rise and formation of a false breakout near 1.1379 triggered a sell entry for the euro, resulting in a drop of more than 30 points for the pair. The technical picture for the second half of the day has not been revised.
To open long positions on EURUSD:
Retail sales data in the eurozone had little impact on the EUR/USD pair, keeping the market within a sideways range. No significant movements are expected in the second half of the day prior to the Federal Reserve's interest rate decision, so I'll stick to the earlier scenario. If the central bank adopts a dovish tone, the dollar could weaken against the euro, leading to a drop toward the 1.1341 support level, which we didn't reach during the European session. A false breakout there would provide a buying opportunity in EUR/USD with the goal of a recovery back to the 1.1379 level, which the pair has been unable to break above. A breakout and retest of this range from above would confirm a valid entry point, targeting 1.1416. The most distant target will be 1.1453, where I plan to take profit. If EUR/USD falls and lacks buyer activity near 1.1341, pressure on the pair will intensify, potentially triggering a deeper move toward 1.1306. Only after a false breakout there would I consider buying the euro. Alternatively, I would open long positions from 1.1269 on a rebound, aiming for an intraday correction of 30–35 points.
To open short positions on EURUSD:
Euro sellers showed their presence, but considering the important data ahead, it's not surprising that bears couldn't break out of the sideways channel. If the euro rises after the Fed decision, bears will once again have to assert themselves around 1.1379. A false breakout at that level would provide a selling opportunity, targeting the 1.1341 support, where moving averages currently favor the bulls. A breakout and consolidation below this range would be a suitable scenario for selling with a target of 1.1306. The furthest goal will be the 1.1269 level, where I'll take profit. A test of this level would break the bullish market structure. If EUR/USD climbs in the second half of the day and bears fail to act near 1.1379—which has already been tested once today—buyers might push for a breakout of 1.1416. I'll only sell there after a failed consolidation. If that level holds as support, I'll look to short on a rebound from 1.1453, aiming for a 30–35 point downward correction.
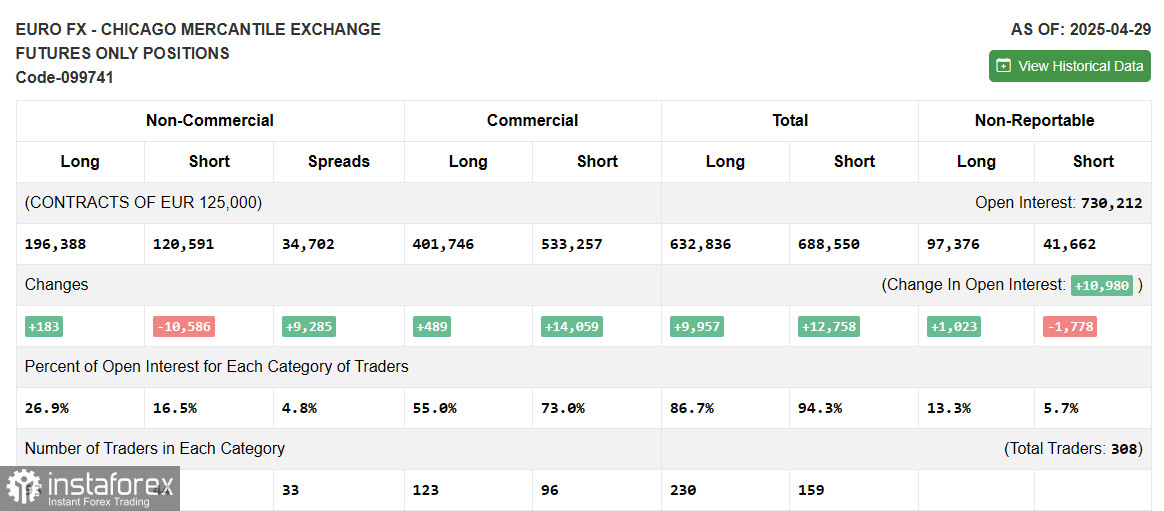
COT Report (Commitment of Traders) for April 29:
There was an increase in long positions and a reduction in short ones. Given that the European Central Bank plans to continue cutting interest rates, this remains a limiting factor that prevents the euro from returning to a bullish trend. Meanwhile, the upcoming Federal Reserve meeting is expected to keep borrowing costs unchanged, which supports the U.S. dollar. The COT report shows that non-commercial long positions increased by 183 to 196,388, while short positions decreased by 10,586 to 120,591. As a result, the gap between long and short positions widened by 9,285.
Indicator signals:
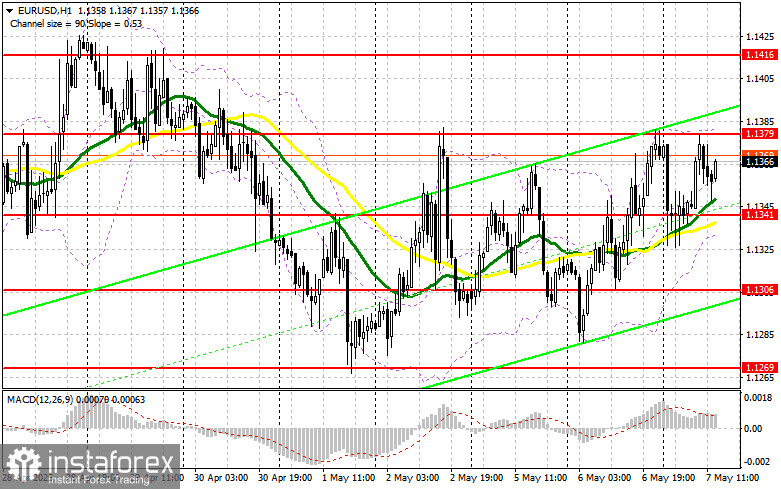
Moving Averages: Trading is occurring near the 30- and 50-period moving averages, indicating market uncertainty.
Note: The period and prices of the moving averages are considered on the H1 chart by the author and differ from the classic daily moving averages on the D1 chart.
Bollinger Bands: In the event of a decline, the lower boundary of the indicator near 1.1330 will serve as support.
Indicator descriptions: • Moving average (MA) – indicates the current trend by smoothing out volatility and noise. Period 50 – shown in yellow on the chart. • Moving average (MA) – Period 30 – shown in green. • MACD (Moving Average Convergence/Divergence): Fast EMA – period 12, Slow EMA – period 26, SMA – period 9. • Bollinger Bands – Period 20. • Non-commercial traders – speculators such as individual traders, hedge funds, and large institutions using the futures market for speculative purposes. • Long non-commercial positions – total long open positions held by non-commercial traders. • Short non-commercial positions – total short open positions held by non-commercial traders. • Total non-commercial net position – the difference between short and long positions held by non-commercial traders.


