See also

 09.05.2025 05:55 AM
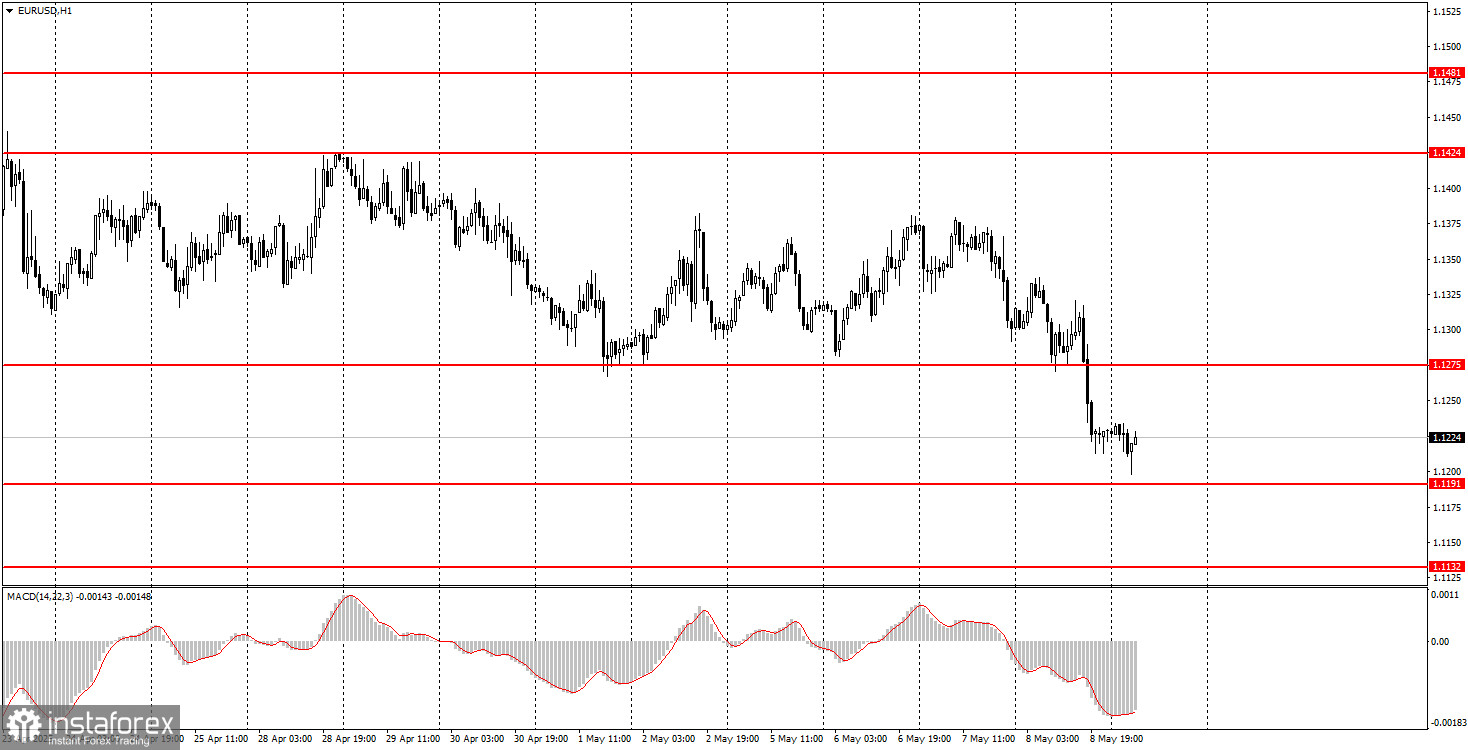
On Thursday, the EUR/USD currency pair unexpectedly exited the sideways channel where it had been trading for three weeks. This occurred during the U.S. trading session, despite the absence of significant macroeconomic data releases and with Donald Trump again refraining from introducing new tariffs or other radical measures. Therefore, explaining why the flat range ended precisely yesterday is difficult. In principle, the overall technical picture had long suggested a correction. No matter how many obstacles Trump places in its path, the dollar cannot fall forever. Moreover, on Wednesday evening, the Federal Reserve again made a hawkish decision by not lowering the key interest rate, and Jerome Powell suggested that there would be no monetary easing through the end of 2025 due to inflation risks. So, there were grounds for the dollar to rise. But those grounds existed on Wednesday evening, while the pair began to decline on Thursday. Even the Bank of England meeting had nothing to do with it, as the British pound remained within its sideways channel, and its decision was announced several hours before the EUR/USD decline began.
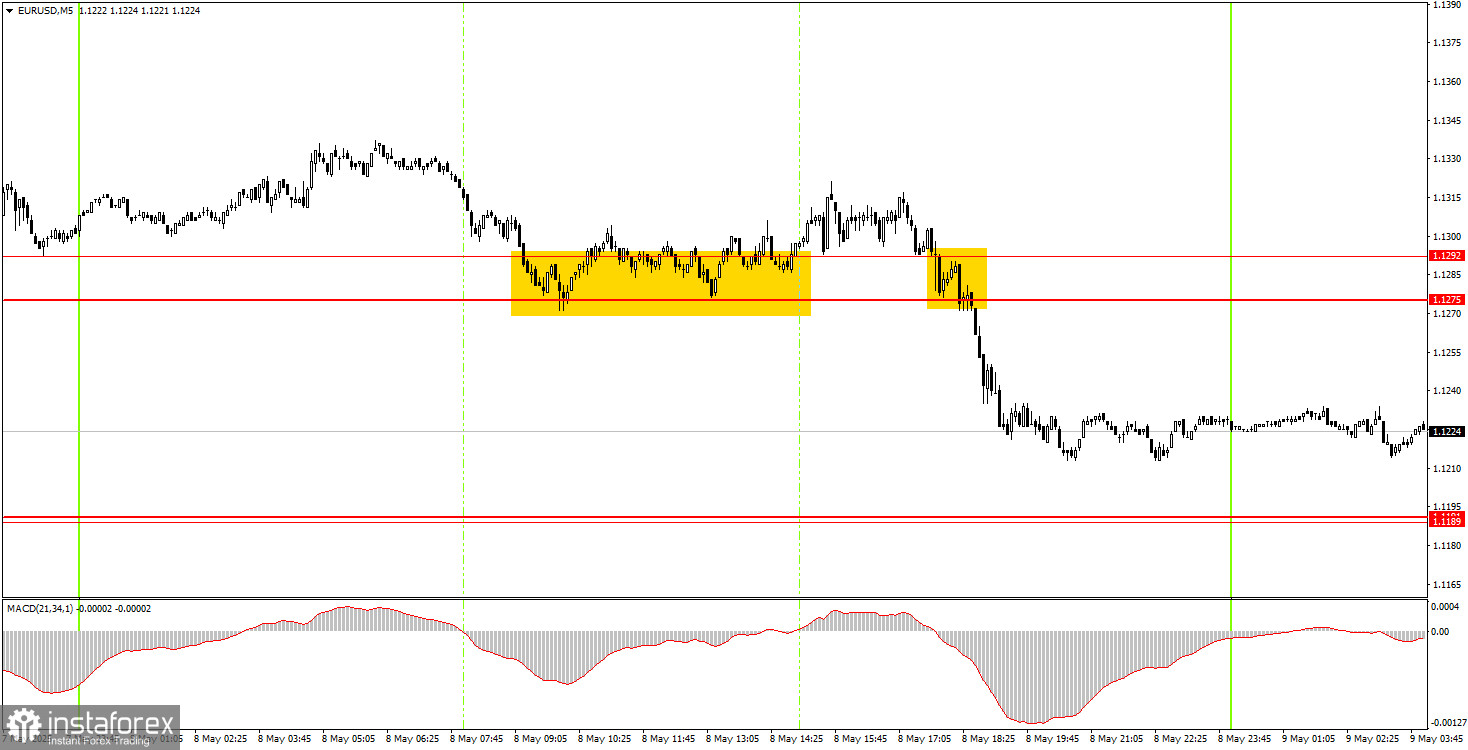
In the 5-minute time frame, two trading signals were formed on Thursday. First, the pair rebounded from the 1.1275–1.1292 area but managed to rise only 20 pips, which was enough to move the Stop Loss to breakeven. Then the pair consolidated below this area, which served as a signal to open short positions. By the end of the day, the price had fallen by 40 pips—a solid profit for novice traders from a very straightforward signal marking the exit from the sideways channel.
The EUR/USD pair is in an upward trend in the hourly time frame. After three weeks of sideways trading, a downward correction has finally begun. Overall, market sentiment remains highly negative toward the U.S. dollar. However, if Trump shifts toward de-escalating the trade conflict he initiated, the dollar could improve its position. It is difficult to predict the strength of the correction following a three-month decline.
No news is expected on Friday, so volatility may be low and movements may again be sideways. The Fed ultimately supported the dollar, but how long will that support last?
On the 5-minute time frame, consider the levels: 1.0940–1.0952, 1.1011, 1.1091, 1.1132–1.1140, 1.1189–1.1191, 1.1275–1.1292, 1.1413–1.1424, 1.1474–1.1481, 1.1513, 1.1548, 1.1571, 1.1607–1.1622, 1.1666, 1.1689. No significant events are scheduled in the Eurozone or the U.S. on Friday. Therefore, unless Trump steps into the spotlight, we expect modest movements within the framework of the ongoing downward trend.
Support and Resistance Levels: These are target levels for opening or closing positions and can also serve as points for placing Take Profit orders.
Red Lines: Channels or trendlines indicating the current trend and the preferred direction for trading.
MACD Indicator (14,22,3): A histogram and signal line used as a supplementary source of trading signals.
Important Events and Reports: These are found in the economic calendar and can heavily influence price movements. Therefore, during their release, you should trade as cautiously as possible or exit the market to avoid a sharp reversal of the price against the previous movement.
Note for Beginner Forex Traders: Not every trade can be profitable. Developing a clear strategy and sound money management is key to long-term success in trading.


