empty
13.05.2025 11:01 AM
GBP/USD – May 13th: Unemployment in Britain Is Rising Again

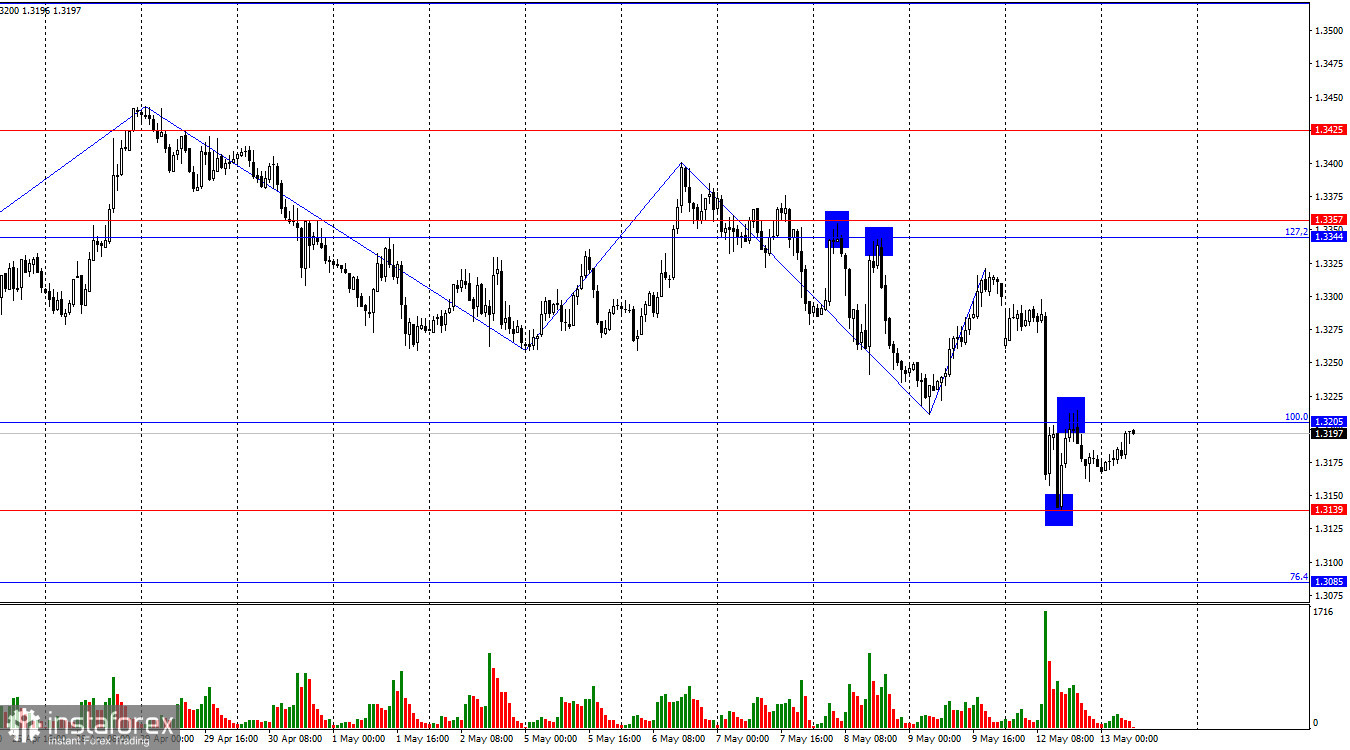
On the hourly chart, the GBP/USD pair fell to the 1.3139 level on Monday, rebounded from it, and rose to the 100.0% Fibonacci level at 1.3205. A rebound from this level will support the U.S. dollar and a renewed decline toward the 1.3085 and 1.3139 levels. A close above 1.3205 would allow expectations for a rise in the pound toward 1.3344.

This image is no longer relevant

Recently, the wave structure has been straightforward. The last completed upward wave failed to break the previous wave's peak, while the last downward wave broke the previous low. Thus, the "bullish" trend is transforming into a "bearish" one. The pound's decline is not yet strong enough to be called a trend, but over the past three months, even such declines have been rare. Bulls will struggle to push above 1.3425 without new statements from Donald Trump regarding tariff hikes or new import duties.

Monday's news backdrop once again favored the bears. The pound's decline began last week after the Bank of England cut interest rates, the FOMC held rates steady, the U.S. signed its first trade agreement with the UK, and reached a deal with China to reduce import tariffs.

These developments have supported the bears, so it's no surprise they launched a strong offensive. Today's UK unemployment report showed the rate rising to 4.5% in March (above forecasts). Employment rose by only 120,000 (below expectations), while wages rose by 5.5% (above forecasts). Among these, the unemployment figure is the most impactful—and it doesn't favor the pound. Therefore, the decline may continue. However, the bears can only attack with obvious support factors. If this favorable backdrop dries up, the pound's decline may stall indefinitely.

This image is no longer relevant

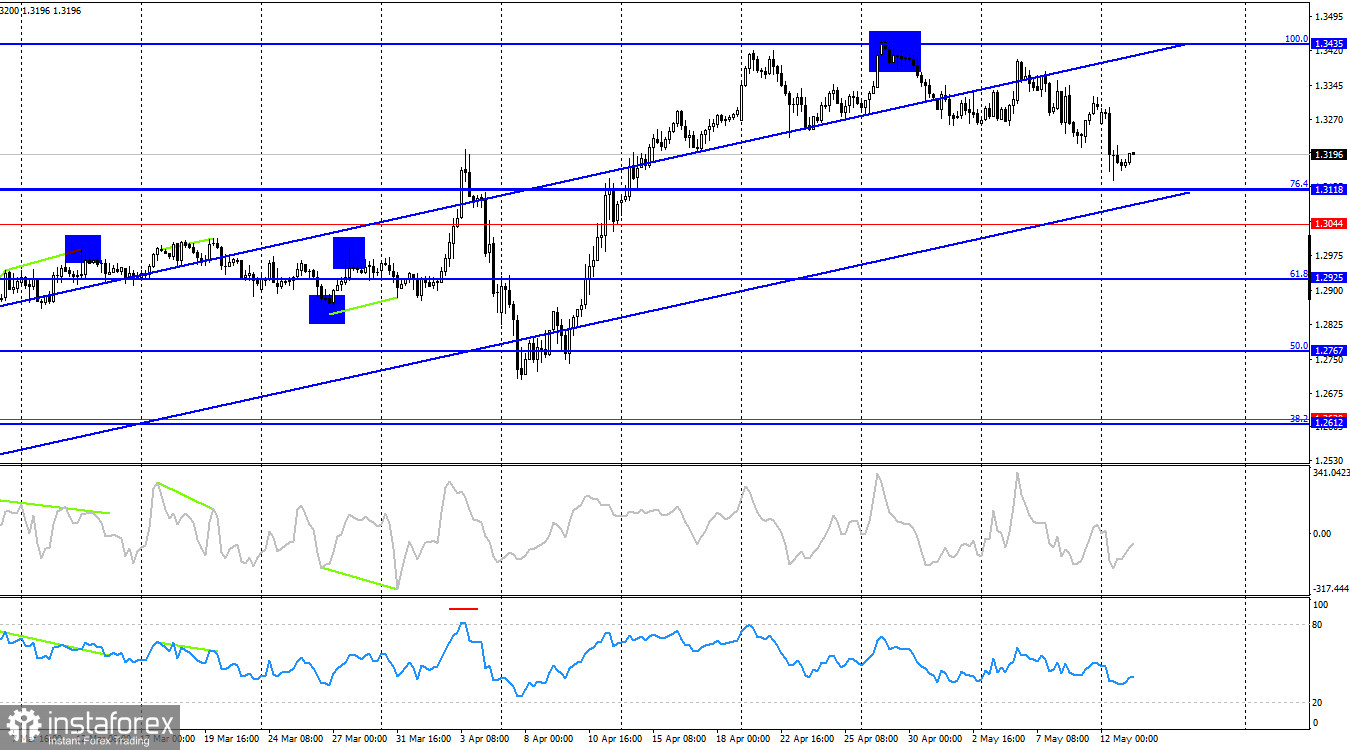
On the 4-hour chart, the pair rebounded from the 100.0% Fibonacci level at 1.3435, turned in favor of the U.S. dollar, and is continuing its decline toward the 76.4% corrective level at 1.3118. No emerging divergences are currently present on any indicators. The ascending trend channel still points to a bullish trend. A bounce from 1.3118 would favor the pound and a potential return to growth toward 1.3435.

Commitments of Traders (COT) Report

This image is no longer relevant

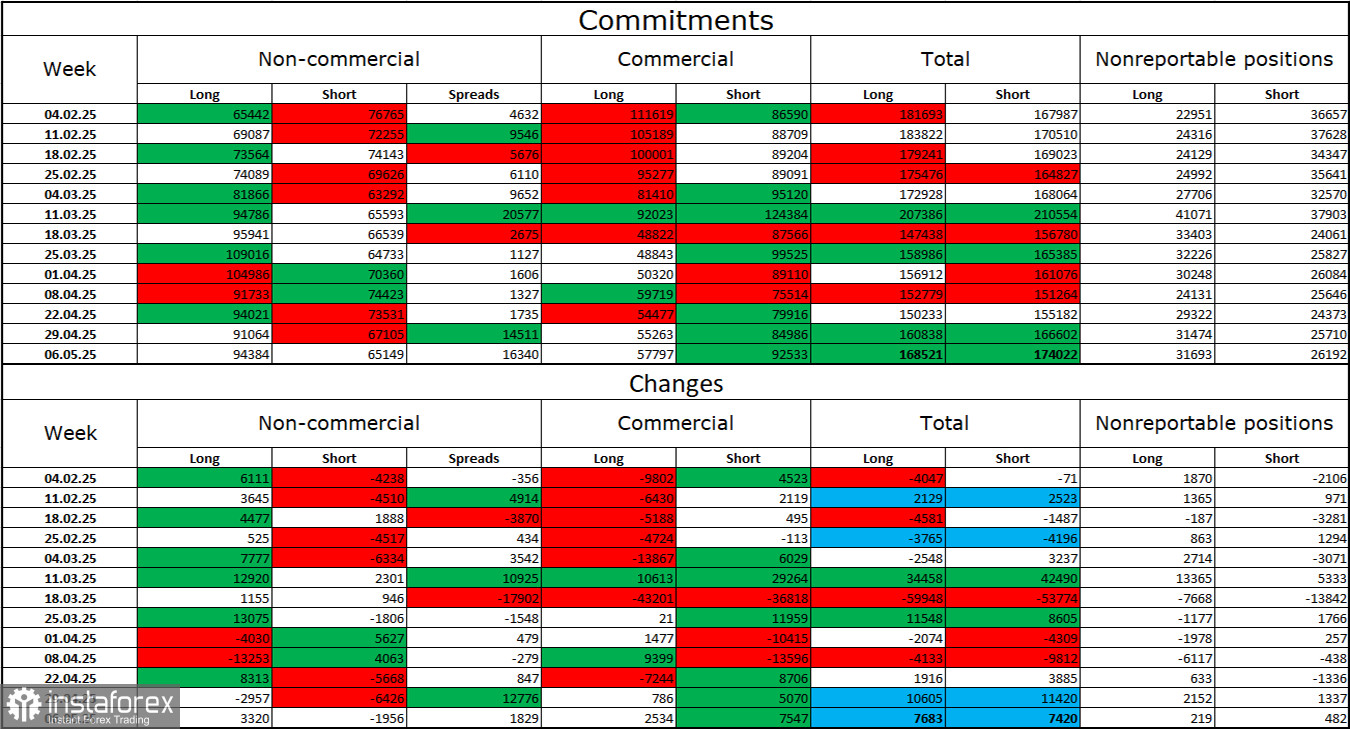
The sentiment among the "Non-commercial" category of traders became more bullish in the latest reporting week. The number of long positions rose by 3,320, while short positions decreased by 1,956. Bears have lost their edge. The gap between long and short positions now favors the bulls by 29,000: 94K vs. 65K.

Although downward potential for the pound remains, recent developments may trigger a longer-term market reversal. Over the past three months, long positions have increased from 65K to 94K, while shorts have dropped from 76K to 65K. Under Trump's leadership, faith in the dollar has been shaken, and COT reports show that traders aren't rushing to buy the greenback.

News Calendar for the UK and US

  • UK – Unemployment Rate (06:00 UTC)
  • UK – Change in Jobless Claims (06:00 UTC)
  • UK – Change in Average Earnings (06:00 UTC)
  • US – Consumer Price Index (12:30 UTC)

Out of four economic releases scheduled for Tuesday, three have already been published. The remaining U.S. inflation report is expected to continue influencing trader sentiment throughout the day.

GBP/USD Forecast and Trading Tips

Sales were possible earlier when the pair closed below the 1.3344–1.3357 zone on the hourly chart and after two rejections from that same zone, targeting 1.3265 and 1.3205. All targets were surpassed. Today, selling is possible on a rebound from 1.3205 with targets at 1.3139 and 1.3085. Buying will be possible if the pair consolidates above 1.3205 on the hourly chart, targeting 1.3344.

Fibonacci grids are drawn from 1.3205–1.2695 on the hourly chart and from 1.3431–1.2104 on the 4-hour chart.

Samir Klishi,
Analytical expert of InstaTrade
© 2007-2025

Recommended Stories

If Crude Oil manages to break below the Pivot level, it has the potential to test its nearest Support level, Thursday, July 03, 2025.

Crude Oil, Thursday, July 03, 2025. Poor global economic conditions such as the stagnation of Chinese & European manufacturing have triggered concerns about global Crude Oil demand and expectations

Arief Makmur 07:36 2025-07-03 UTC+2

The Nasdaq 100 index has the potential to test its closest Resistance level, Thursday, July 03, 2025.

Nasdaq 100 Index, Thursday, July 03, 2025. Positive Big Tech Company financial reports and the increasingly strong rumors of the Fed's Dovish policy and the rise of AI innovation have

Arief Makmur 07:36 2025-07-03 UTC+2

EUR/AUD Forecast for July 3, 2025

On the daily chart, the EUR/AUD pair is moving sideways in the upper half of the price channel and above the MACD indicator line. The signal line of the Marlin

Laurie Bailey 06:33 2025-07-03 UTC+2

EUR/USD Forecast for July 3, 2025

Ahead of today's U.S. employment data release for June, the euro consolidated near the price channel line on the daily chart. The long lower shadow of the candlestick suggests that

Laurie Bailey 05:11 2025-07-03 UTC+2

GBP/USD Forecast for July 3, 2025

By the end of yesterday, the British pound had lost 108 pips. Although the reason was not the anticipation of today's U.S. employment data, but rather domestic political turmoil, this

Laurie Bailey 05:11 2025-07-03 UTC+2

Silver Forecast for July 3, 2025

After two days of intense struggle (Monday and Tuesday) between the bulls and bears along the price channel line amid heightened volatility, yesterday we saw the outcome — the bulls

Laurie Bailey 05:11 2025-07-03 UTC+2

Trading Signals for EUR/USD for July 2-5, 2025: sell below 1.1840 (+1/8 Murray - 21 SMA)

If the euro breaks below 1.1762 and consolidates below this price zone, a bearish acceleration is likely and could reach the bottom of the trend channel around 1.1620. It could

Dimitrios Zappas 19:00 2025-07-02 UTC+2

Trading Signals for GOLD (XAU/USD) for July 2-8, 2025: buy above 3,325 (21 SMA - 200 EMA)

Gold could be preparing for a new bullish sequence, so as the price consolidates above 3,325 or 3,312, any technical rebound will be seen as a buying signal, with short-term

Dimitrios Zappas 18:58 2025-07-02 UTC+2

USD/JPY. Analysis, Forecast, and Current Market Situation

Negative oscillators on the 4-hour chart indicate that any further upward movement can be viewed as a selling opportunity. From a technical standpoint, the presence of negative oscillators

Irina Yanina 18:48 2025-07-02 UTC+2

Forex forecast 02/07/2025: EUR/USD, USD/CAD, GBP/USD, Oil and Bitcoin

Useful links: My other articles are available in this section InstaForex course for beginners Popular Analytics Open trading account Important: The begginers in forex trading need to be very careful

Sebastian Seliga 12:12 2025-07-02 UTC+2
Can't speak right now?
Ask your question in the chat.
 

Dear visitor,

Your IP address shows that you are currently located in the USA. If you are a resident of the United States, you are prohibited from using the services of InstaFintech Group including online trading, online transfers, deposit/withdrawal of funds, etc.

If you think you are seeing this message by mistake and your location is not the US, kindly proceed to the website. Otherwise, you must leave the website in order to comply with government restrictions.

Why does your IP address show your location as the USA?

  • - you are using a VPN provided by a hosting company based in the United States;
  • - your IP does not have proper WHOIS records;
  • - an error occurred in the WHOIS geolocation database.

Please confirm whether you are a US resident or not by clicking the relevant button below. If you choose the wrong option, being a US resident, you will not be able to open an account with InstaTrade anyway.

We are sorry for any inconvenience caused by this message.