See also

 19.05.2025 04:42 AM
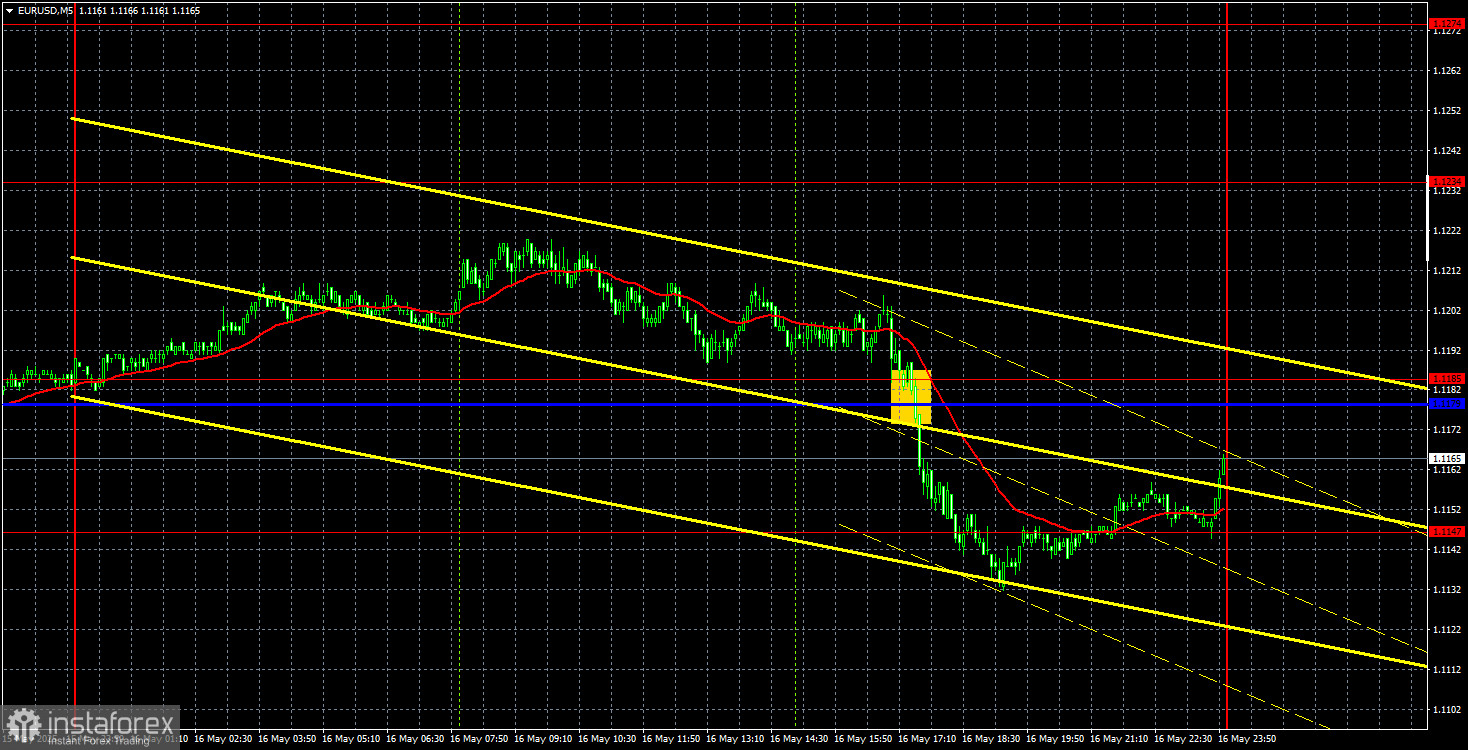
The EUR/USD currency pair showed a slight decline on Friday. Although the 5-minute chart might suggest the pair spent the entire day in a downtrend, the U.S. dollar gained only 19 pips overall—barely enough to qualify as growth. Generally, the American currency continues its sluggish upward movement, supported by fundamental factors such as the Federal Reserve's reluctance to cut interest rates and the trade war de-escalation. However, the market remains skeptical of the dollar, buying it superficially. Unfortunately, Donald Trump's policy is currently the dollar's biggest enemy.
On Friday, there were arguably more reasons for the market to sell the dollar than to buy it. There were no significant events or news from the Eurozone, and the U.S. released three reports that usually don't trigger market reactions. Nevertheless, all three—housing starts, building permits, and the University of Michigan consumer sentiment index—came in below expectations. Despite this, the dollar strengthened during their release, confirming once again that there is currently no clear connection between the macroeconomic environment and market movements.
The 5-minute chart gave only one tradable signal. During the U.S. session, the price consolidated below the 1.1179–1.1185 area, continued falling, and reached the next target at 1.1147. This level was suitable for closing short positions, making the day modestly profitable.
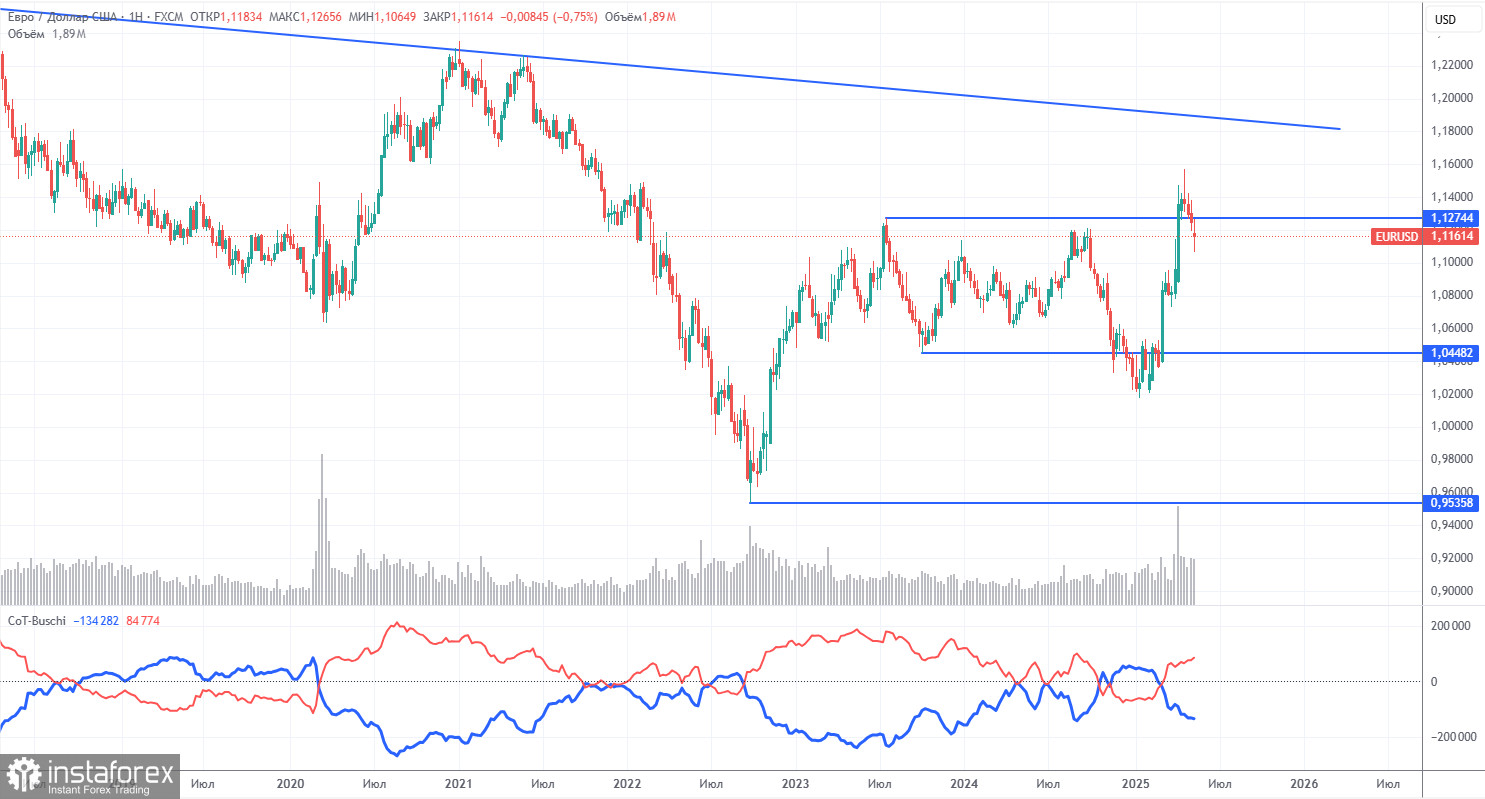
The most recent Commitment of Traders (COT) report is dated May 13. As the chart above illustrates, the net position of non-commercial traders has long remained bullish. Bears briefly overtook but quickly lost control. Since Trump took office, the dollar has been falling sharply. While we can't guarantee that this decline will continue indefinitely, COT reports reflect the sentiment of major market players, though in current circumstances, that sentiment can shift quickly.
There are no fundamental reasons for the euro to strengthen, but the dollar faces a significant political burden. EUR/USD may continue to correct for several more weeks or months, but the broader 16-year downtrend won't reverse so quickly. Once Trump's trade wars end, the dollar may resume its upward trend.
The red and blue lines on the COT chart have crossed again, signaling a renewed bullish trend. During the last reporting week, the number of long positions from non-commercial traders increased by 15,400, while shorts rose by 6,300. As a result, the net position grew by 9,000 contracts.
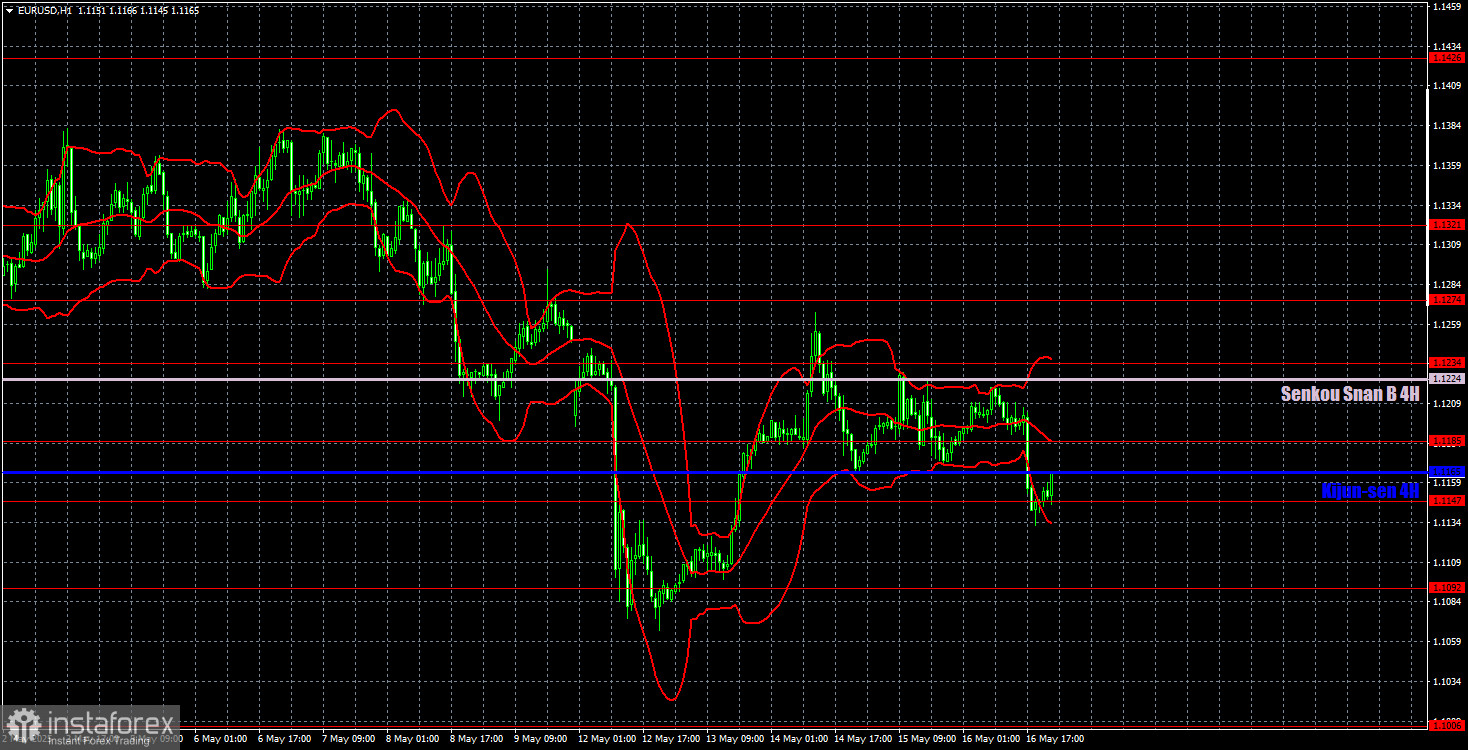
In the hourly timeframe, EUR/USD continues to show a relatively mild decline that, from a broader perspective, looks more like a correction. The pair's downward movement is still tied to the easing of global trade tensions. If trade agreements continue to be signed and tariffs lowered, the U.S. dollar could further recover to levels where the recent downtrend began. Currently, market movement is not driven by technical analysis or macroeconomic data, but rather by developments in global trade negotiations.
On May 19, we highlight the following levels for trading: 1.0823, 1.0886, 1.0949, 1.1006, 1.1092, 1.1147, 1.1185, 1.1234, 1.1274, 1.1321, 1.1426, 1.1534, as well as the Senkou Span B (1.1224) and Kijun-sen (1.1165) lines. The lines of the Ichimoku indicator can move during the day, which should be considered when determining trading signals. Always set Stop Loss to breakeven after the price moves 15 points in your favor to protect against potential losses from false signals.
No major events are scheduled in the Eurozone or the U.S. on Monday, so we don't expect significant market moves. Trading will rely solely on technical levels and indicator lines. The bearish trend remains intact, so the dollar may attempt to rise again. However, as we've seen repeatedly, the market remains disinterested in buying the dollar, ignoring many of the positive catalysts that could support its strength.


