See also

 19.05.2025 10:45 AM
On Friday, the EUR/USD pair continued its moderate decline. A close below the 127.2% Fibonacci level at 1.1181 was recorded, but bears failed to build on that success. The current news backdrop is mixed: on one hand, the trade war is shifting toward a truce; on the other, U.S. economic data remains lackluster. Bears are also wary of potential surprises from Donald Trump, which could trigger another wave of dollar sell-off
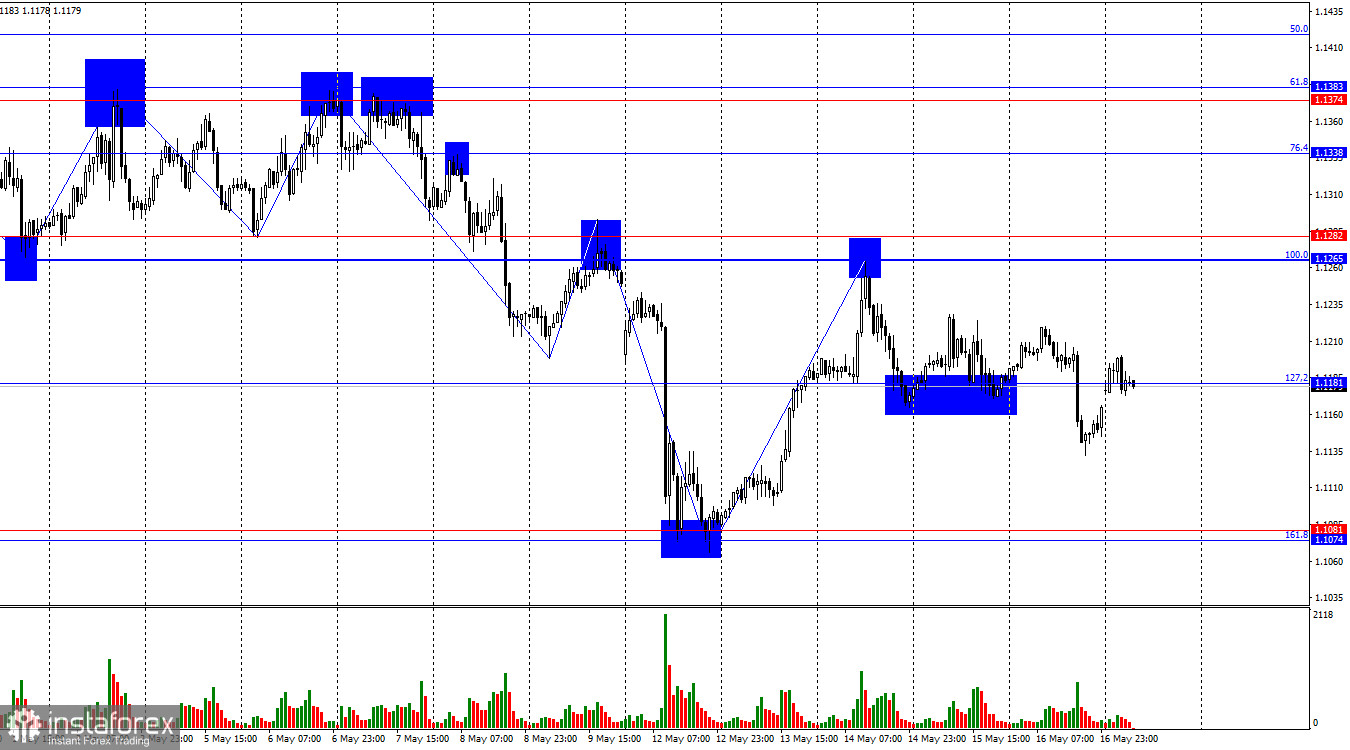
On the hourly chart, the wave picture is clear. The last completed upward wave failed to break the previous peak, while the last downward wave breached the previous low, keeping the trend in a bearish phase. News about progress in U.S.-China trade negotiations and the Fed's hawkish stance support the bears, but many challenges remain on their path to victory.
Despite three U.S. reports released Friday, the news had little impact. Building permits and housing starts both fell short of forecasts, and the University of Michigan's consumer sentiment index dropped from 52.2 to 50.8. These are not the kinds of figures that inspire strong bearish momentum. Still, the dollar managed to gain some ground, though bulls counterattacked as early as Monday. As mentioned before, the bears remain fragile, fearing potential monetary policy easing by the Fed in response to any inflation surge—and, perhaps more significantly, fearing new shocks from Donald Trump. The U.S. dollar is no longer seen as a pillar of stability, and Trump has only been in office for four months—yet the number of crises during this short period has already broken records.
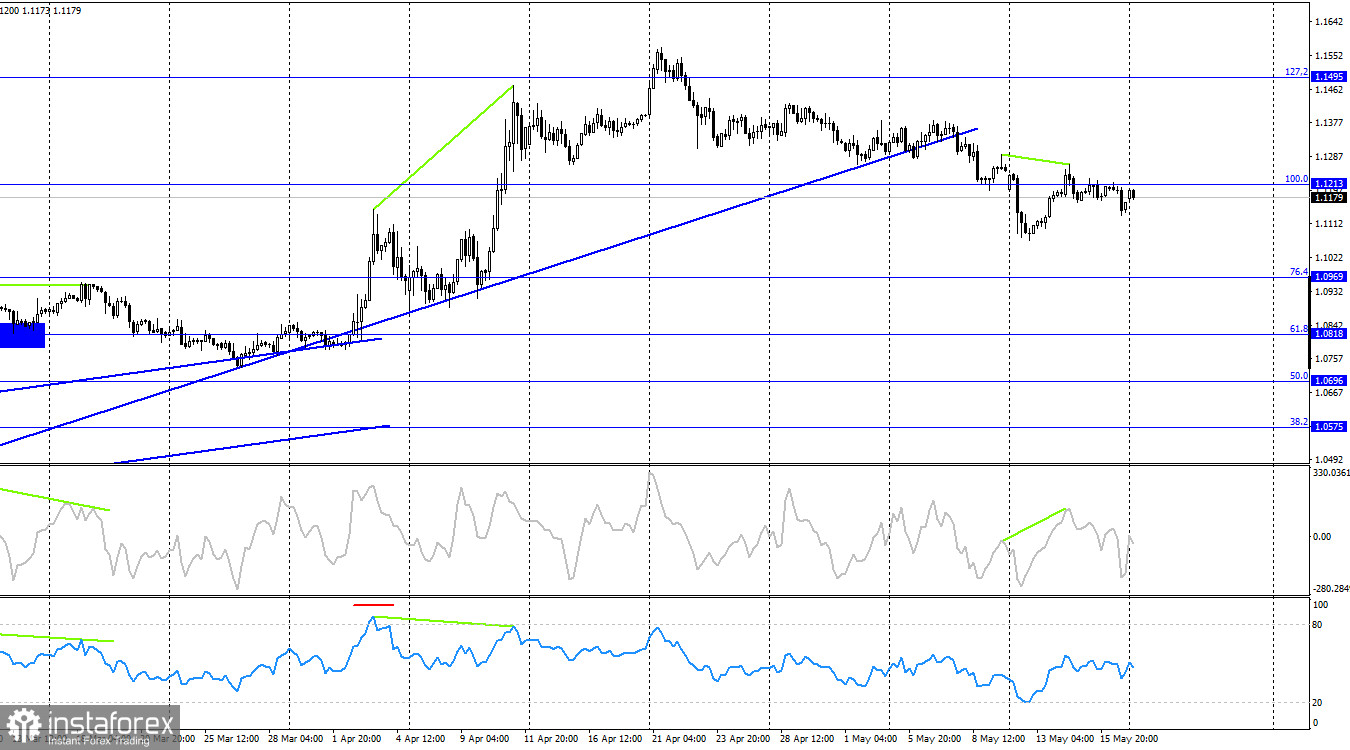
On the 4-hour chart, the pair closed below the 100.0% Fibonacci level at 1.1213, which may open the path for a continuation of the decline toward the next retracement level at 76.4% (1.0969). A move back above 1.1213 would favor the euro and revive the bullish trend toward the 127.2% Fibonacci level at 1.1495. A bearish divergence in the CCI indicator increases the likelihood of further declines.
Commitments of Traders (COT) Report:
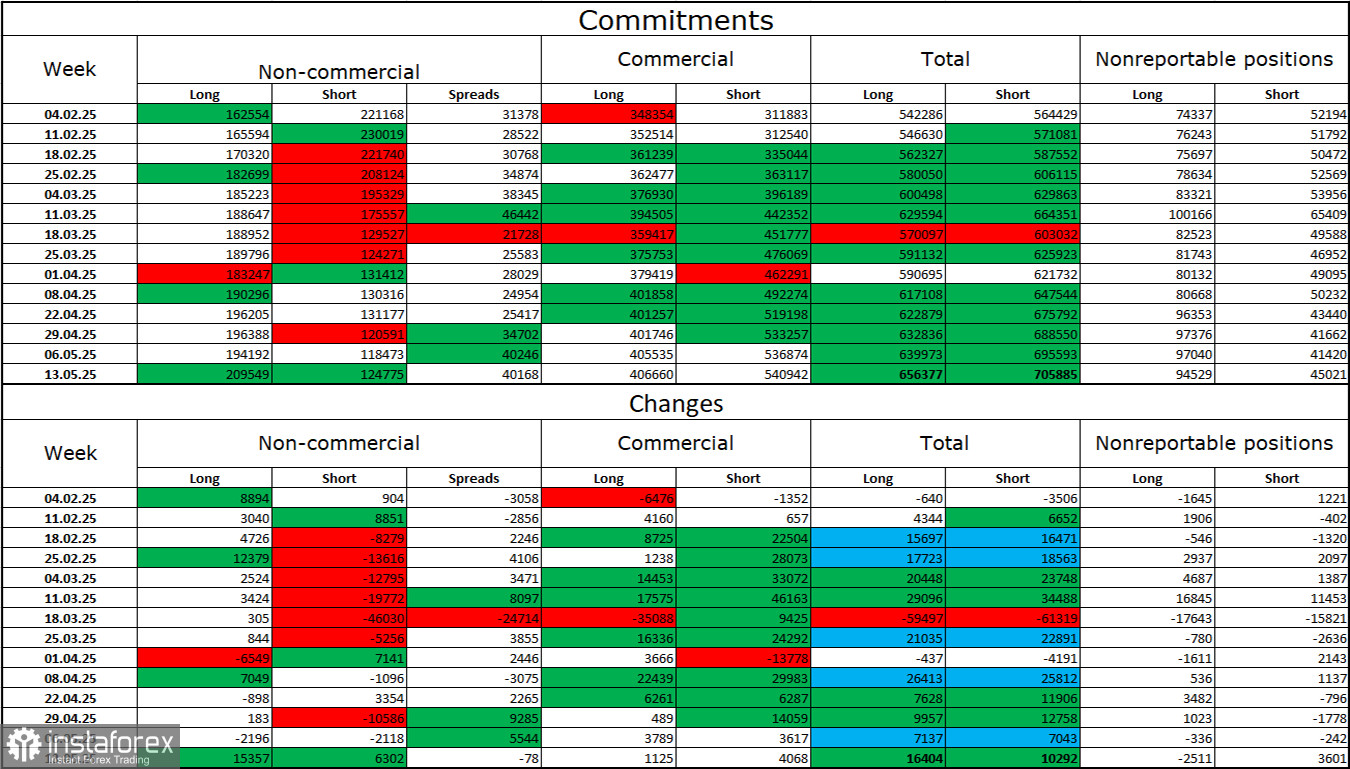
In the latest reporting week, professional traders opened 15,357 long positions and 6,302 short positions. The "Non-commercial" group has long shown a bullish tilt—thanks largely to Donald Trump. Total long positions now stand at 209,000, compared to 124,000 shorts, and the gap continues to widen. This means demand for the euro remains strong, while the dollar lacks support. The trend hasn't changed.
For 15 consecutive weeks, large players have been unwinding short positions and building long ones. While differences in monetary policy between the ECB and Fed still favor the dollar based on interest rate differentials, Trump's policies are a more significant factor for traders, as they could lead to a U.S. recession. As a result, dollar bulls cannot—or do not want to—capitalize on the Fed's current stance.
Economic Calendar for the U.S. and Eurozone:
Eurozone – Consumer Price Index (09:00 UTC)
Only one event is on the calendar for May 19. As such, news-driven market impact on Monday is expected to be minimal.
EUR/USD Forecast and Trading Tips:
Selling the pair is viable today if it closes below the 1.1181 level on the hourly chart, with targets at the 1.1074–1.1081 support zone. I wouldn't recommend considering long positions at this time, as I do not see any strong bullish patterns forming.
Fibonacci grids:


