See also

 30.05.2025 06:37 AM
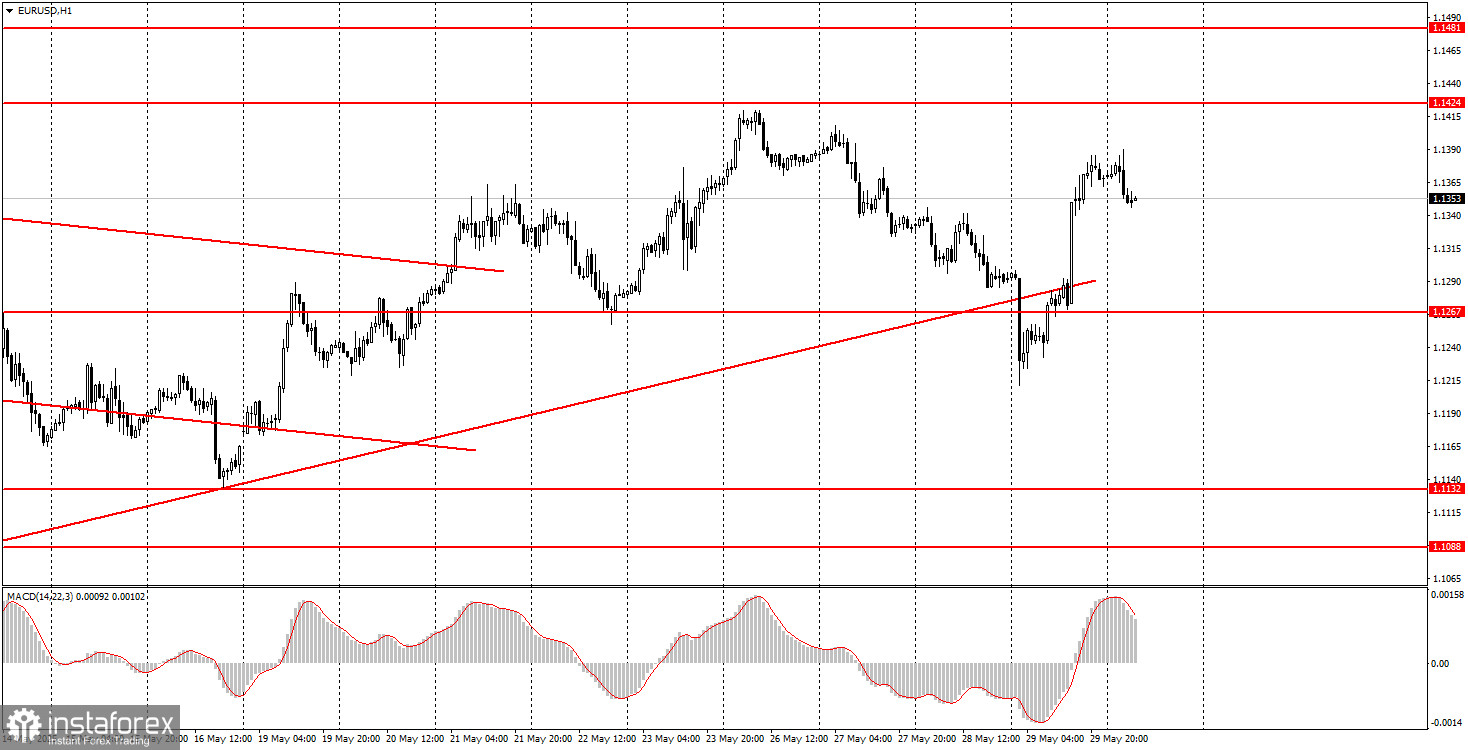
The EUR/USD currency pair started Thursday with a sharp collapse but spent the rest of the day trading with strong growth. Explaining the pair's movements on Thursday is quite difficult, but we'll attempt to do so. Overnight (when the dollar sharply strengthened), it became known that the U.S. Court of International Trade ruled to cancel most of the tariffs introduced by Donald Trump. The Manhattan court determined that the president had no rights or authority for such actions. Only Congress can impose global trade tariffs. This news caused the dollar's rise. Why did it start falling sharply afterward? Because Trump immediately began pressuring the court, announced that he would file an appeal, and threatened to take the case to the U.S. Supreme Court. By the evening, the Manhattan court suspended its decision for 14 days. Just like that, Trump resolved the issue quickly and easily. The trade war continues, the tariffs remain in place, so the dollar collapsed again.
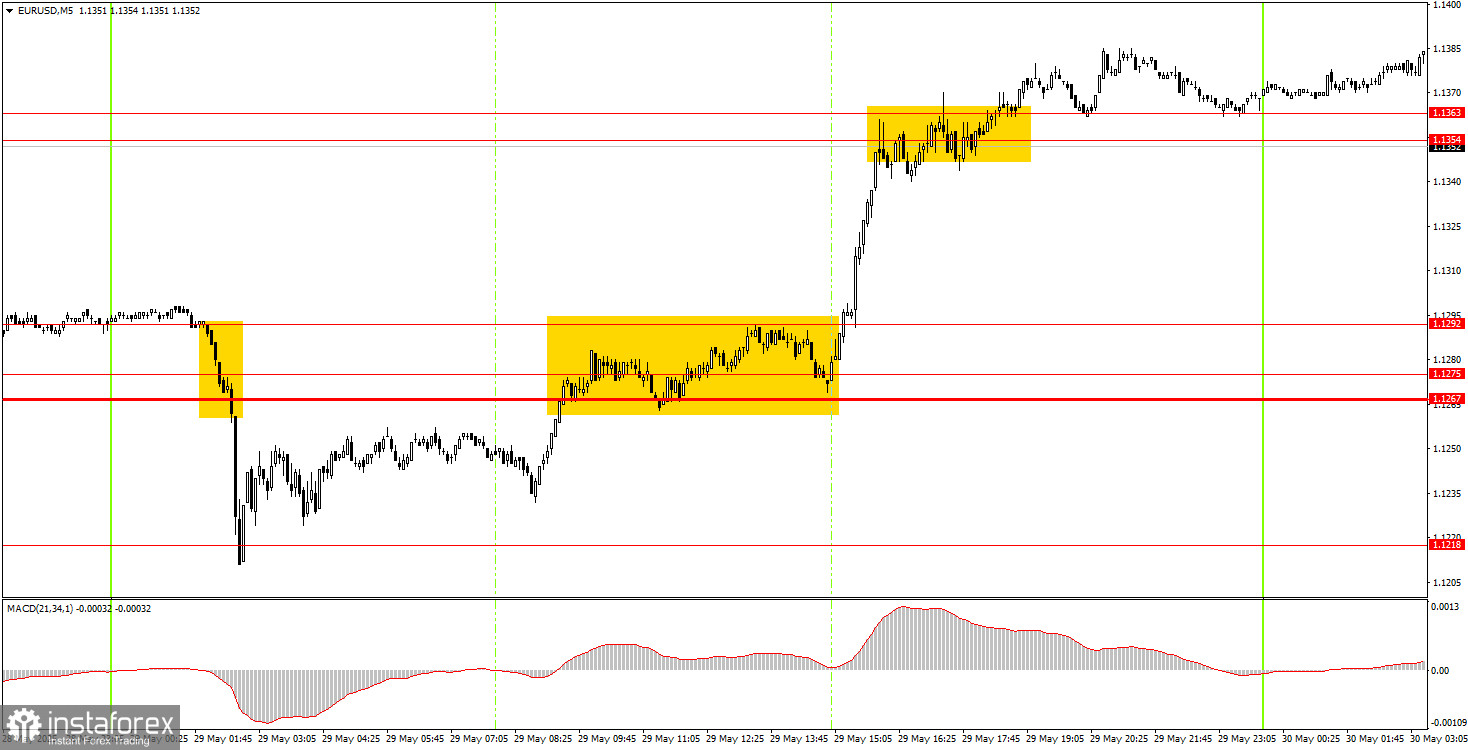
Two very good trading signals were formed on Thursday's 5-minute timeframe. During the entire European trading session, the pair tried to break through the 1.1267-1.1292 area, and at the start of the American session, it finally succeeded. A strong rally followed, ending only above the 1.1354-1.1363 area. It was possible to close long positions there. The profit amounted to at least 60–70 pips.
In the hourly timeframe, the EUR/USD pair has broken through the ascending trendline, but the uptrend that began as soon as Trump became president could very well continue. In principle, the fact that Trump is the U.S. president is already sufficient reason for the market to flee from the dollar without hesitation. If Trump again starts threatening, issuing ultimatums, and imposing/raising tariffs, the market will have few options. Trump's tariffs have not yet been overturned, so the trade war situation remains unchanged.
On Thursday, the EUR/USD pair might resume a downward correction now that the trendline has been broken. At the same time, the dollar has no strong reasons for significant growth.
For the 5-minute timeframe, the following levels should be considered: 1.0940-1.0952, 1.1011, 1.1088, 1.1132-1.1140, 1.1198-1.1218, 1.1267-1.1292, 1.1354-1.1363, 1.1413-1.1424, 1.1474-1.1481, 1.1513, 1.1548, 1.1571, 1.1607-1.1622.
Germany is scheduled to release reports on retail sales and inflation for May on Friday. In the current circumstances, these are secondary reports. Similarly, secondary reports will be released in the U.S., such as the Personal Consumption Expenditures (PCE) Price Index, personal income/spending of American consumers, and the University of Michigan Consumer Sentiment Index.
Support and Resistance Levels: These are target levels for opening or closing positions and can also serve as points for placing Take Profit orders.
Red Lines: Channels or trendlines indicating the current trend and the preferred direction for trading.
MACD Indicator (14,22,3): A histogram and signal line used as a supplementary source of trading signals.
Important Events and Reports: Found in the economic calendar, these can heavily influence price movements. Exercise caution or exit the market during their release to avoid sharp reversals.
Forex trading beginners should remember that not every trade will be profitable. Developing a clear strategy and practicing proper money management are essential for long-term trading success.


