
See also


 28.08.2026 08:29 AM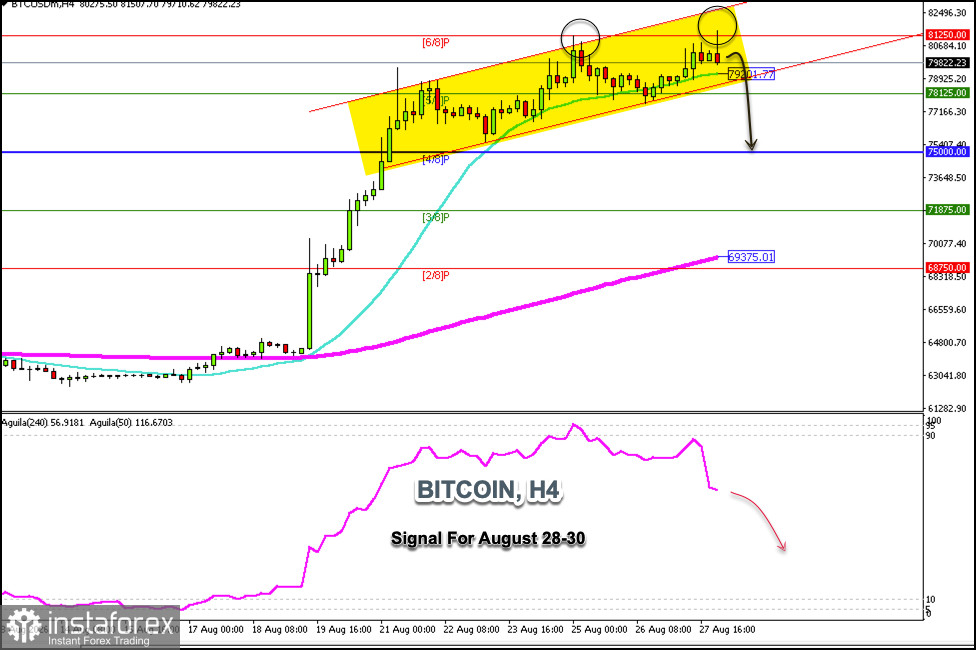
Bitcoin is trading around $79,822, pulling back after hitting the strong Murray 6/8 resistance level, and we can also see on the H4 chart that BTC has formed a double-top pattern.
This double-top pattern could signal a downtrend for Bitcoin, but for this to occur, we would need confirmation if BTC trades below $78,125, where the 5/8 Murray level is located.
If there is a drop below the 21 SMA, Bitcoin could continue to fall in the coming days, with a pullback to the 61.8% Fibonacci level likely, and it could eventually reach $75,000; ultimately, we expect it to reach the psychological level of $70,000.
Conversely, as long as Bitcoin stages a technical rebound above $79,000—around the lower band of the uptrend channel—this could be seen as a buy signal in the coming days, with the expectation that it will reach $81,250 and could even hit the upper band of the uptrend channel, which is around $82,900.
Bitcoin is currently overbought, and the Eagle indicator is showing a negative signal. Therefore, if BTC makes another attempt to break through the 6/8 Murray level and fails to overcome this zone, we could view this level as an opportunity to sell Bitcoin, with short-term targets at $70,000.
You have already liked this post today
*The market analysis posted here is meant to increase your awareness, but not to give instructions to make a trade.


