See also

 11.06.2025 09:01 AM
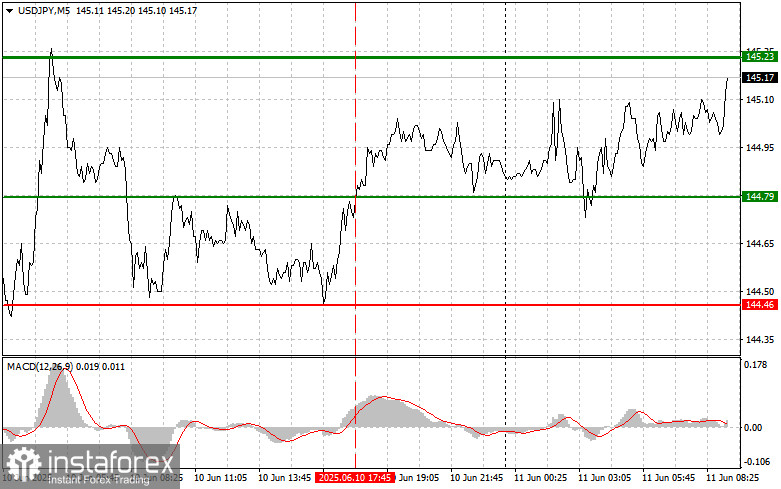
The test of the 144.79 level occurred when the MACD indicator had already moved significantly above the zero line, which limited the pair's upside potential. For this reason, I did not buy the dollar.
The USD/JPY rally continued following positive news that China and the U.S. had reached a consensus on key trade disagreements, strengthening the dollar and weakening the yen. Optimism over easing trade tensions spurred capital inflows into the U.S. dollar at the expense of the safe-haven yen. This momentum pushed USD/JPY to new highs, breaking through several resistance levels. Technical indicators also confirm the bullish trend, suggesting further upside potential. However, it's important to remember that markets remain sensitive to any changes in trade negotiation rhetoric.
Market focus will shift to macroeconomic data releases from the U.S. and Japan in the short term. Strong economic data from the U.S. may further boost the dollar, while disappointing indicators from Japan could put pressure on the yen. It is essential to pay close attention to the upcoming U.S. inflation data, as it may affect expectations about future actions by the Federal Reserve. (We will discuss this in more detail in the afternoon forecast.)
For intraday strategy, I will focus primarily on implementing Scenarios #1 and #2.
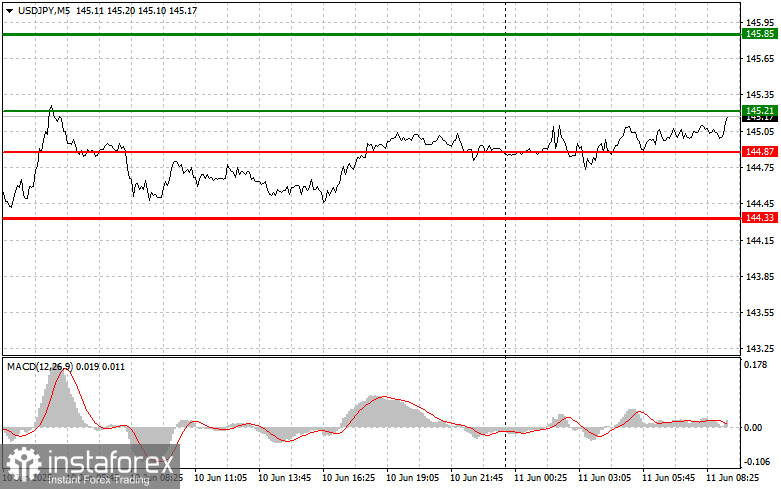
Scenario #1: Plan to buy USD/JPY today at the 145.21 level (green line on the chart), targeting a rise to 145.85 (thicker green line on the chart). Around 145.85, I plan to exit long positions and initiate short positions in the opposite direction (expecting a pullback of 30–35 pips from the entry level). It's best to return to buying the pair during corrections and significant dips in USD/JPY.
Important: Before buying, ensure the MACD is above the zero line and just beginning to rise.
Scenario #2: Also, plan to buy USD/JPY if there are two consecutive tests of the 144.87 level while the MACD is in oversold territory. This would limit the downside potential and trigger an upward market reversal—expected targets: 145.21 and 145.85.
Scenario #1: Plan to sell USD/JPY only after a break below 144.87 (red line on the chart), which should lead to a sharp drop in the pair. The key target for sellers is 144.33, where I plan to exit short positions and open long positions in the opposite direction (expecting a rebound of 20–25 pips from the level). Selling pressure may return quickly today.
Important: Before selling, ensure the MACD is below the zero line and beginning to decline.
Scenario #2: Also plan to sell USD/JPY if there are two consecutive tests of the 145.21 level while the MACD is in overbought territory. This would cap the pair's upward momentum and result in a downward reversal—expected targets: 144.87 and 144.33.