See also

 13.06.2025 12:37 PM
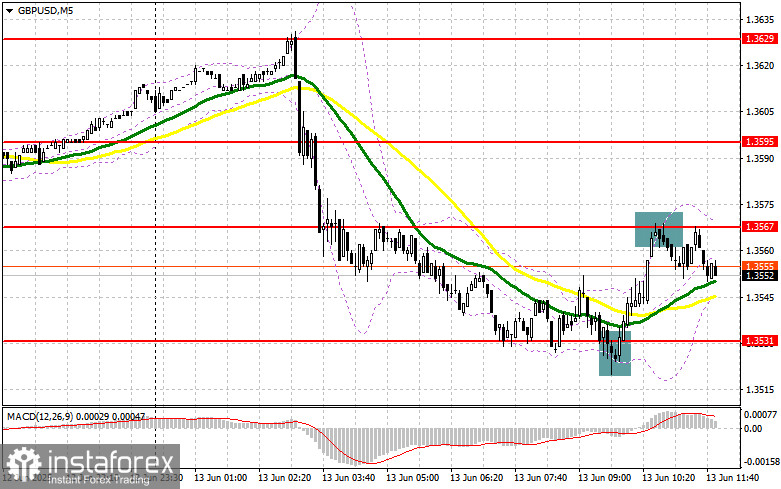
In my morning forecast, I highlighted the 1.3531 level and planned to make trading decisions based on it. Let's look at the 5-minute chart and analyze what happened. A decline followed by a false breakout at this level led to a long entry on the pound, resulting in a rise of more than 35 points. The technical picture was not revised for the second half of the day.
To Open Long Positions on GBP/USD:
The University of Michigan Consumer Sentiment Index and inflation expectations are the only major data expected in the second half of the day. I don't believe these releases will have much impact on the market, so it's better to focus on updates regarding the Israel–Iran conflict.
If GBP/USD declines, I would prefer to act near the newly formed support at 1.3531. A false breakout there will provide a solid long entry signal, aiming for a return to the 1.3567 resistance — a level that couldn't be breached in the first half of the day. A breakout with a retest from top to bottom of this range would provide a new long entry with the prospect of reaching 1.3595. The furthest upward target will be 1.3629, where I plan to take profits.
If GBP/USD falls and bulls show no activity around 1.3531 in the second half of the day, pressure on the pound may increase. In that case, only a false breakout around 1.3503 will be an appropriate setup to open long positions. Alternatively, I'll look to buy GBP/USD on a direct rebound from 1.3465, targeting a 30–35 point intraday correction.
To Open Short Positions on GBP/USD:
Sellers did everything possible and performed well around 1.3567. The focus for the second half of the day remains on this level. A false breakout there, as discussed earlier, will provide an entry point for short positions, targeting a drop to the 1.3531 support. A breakout and retest of this range from below will likely trigger stop-losses and open the way to 1.3503. The furthest target will be the 1.3465 level, where I plan to take profits.
If demand for the pound returns in the second half of the day and bears remain inactive near 1.3567, a stronger GBP/USD rally cannot be ruled out. In that case, it's better to wait for a test of the 1.3595 resistance before selling. I will only open shorts there after a false breakout. If the pair doesn't drop there either, I'll look to open shorts on a rebound from 1.3629, targeting a 30–35 point correction.
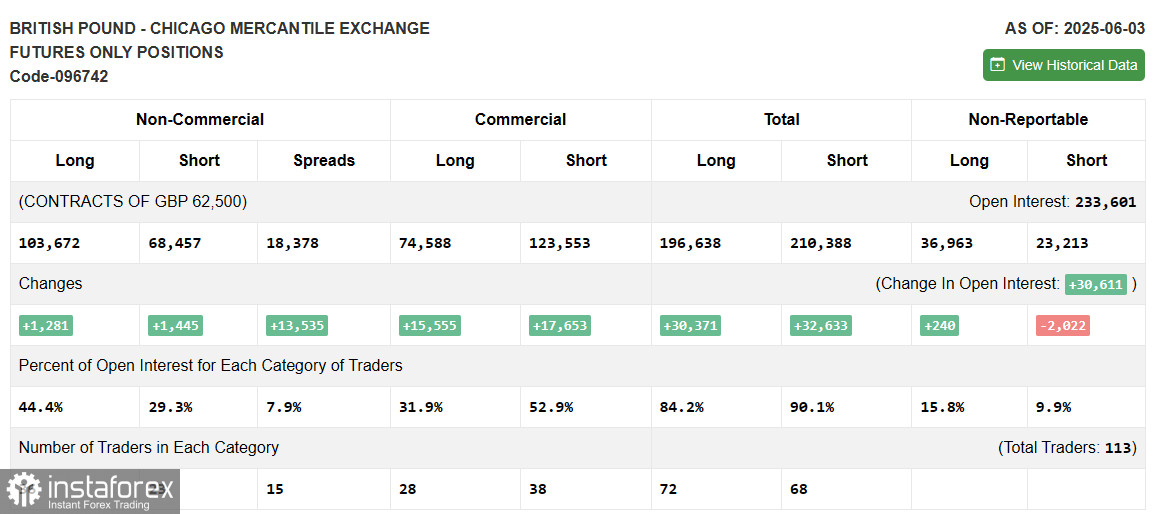
The COT (Commitments of Traders) report from June 3 showed an increase in both long and short positions, but the growth was relatively balanced and didn't result in a major shift in market positioning. Traders are awaiting new fundamental data from the UK, including GDP and inflation reports, which could significantly impact the Bank of England's rate decisions.
Additionally, U.S. inflation figures are expected this week, which could influence broader sentiment. The latest COT report shows long non-commercial positions increased by 1,281 to 103,672, while short positions rose by 1,445 to 68,457. As a result, the gap between longs and shorts widened by 13,535.
Indicator Signals:
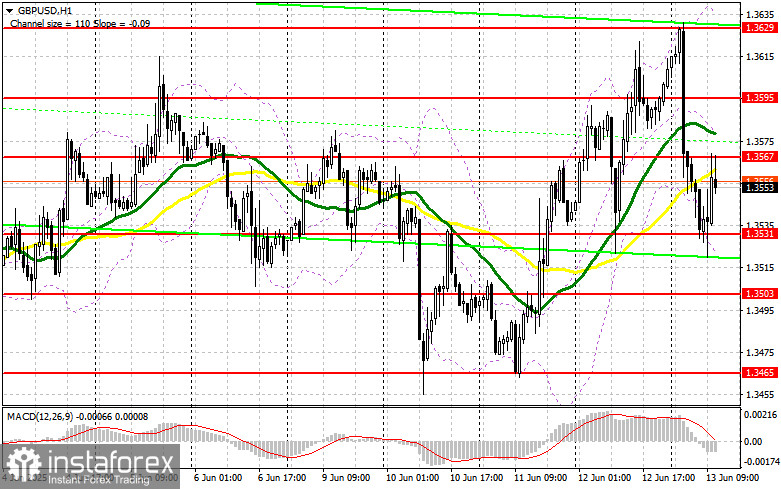
Moving AveragesTrading is taking place around the 30- and 50-period moving averages, indicating market uncertainty.
Note: The author uses H1 (hourly chart) data, which differs from classic D1 (daily) moving average setups.
Bollinger BandsIf the pair declines, the lower boundary of the indicator near 1.3525 will serve as support.
Indicator Descriptions:


