empty
17.06.2025 04:48 AM
GBP/USD Forecast for June 17, 2025

The British pound is gradually squeezed between the MACD line on the daily chart and the resistance level at 1.3635. The key question now is: which direction will the price break in the coming days?

This image is no longer relevant

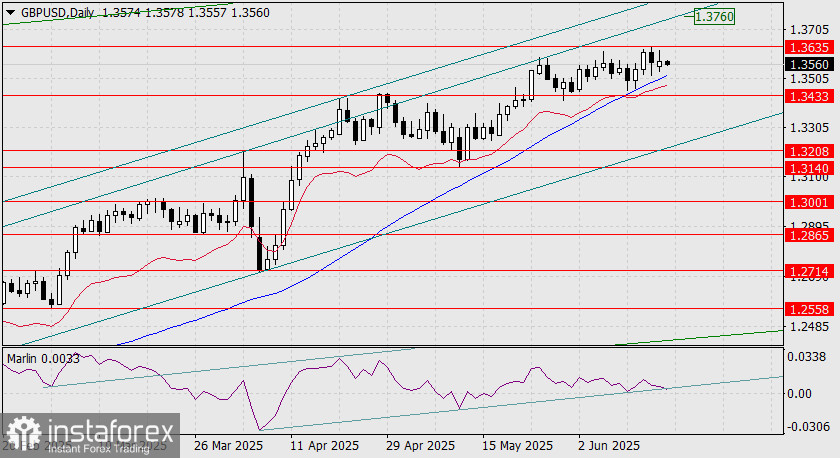
The Marlin oscillator testing the lower boundary of its own channel increases the likelihood of an upward breakout. A confirmation would be a break above the 1.3635 level. The nearest target would then be the inner price channel line at 1.3760, followed potentially by continued growth toward 1.3834—the peak from October 2021.

The price is currently moving below the MACD line on the four-hour chart, but this is generally a neutral sign within triangular formations. However, if the price consolidates above the MACD line (1.3590), it would signal an upcoming bullish breakout from the triangle, especially since no firm break above this line has occurred since the triangle's formation.

This image is no longer relevant

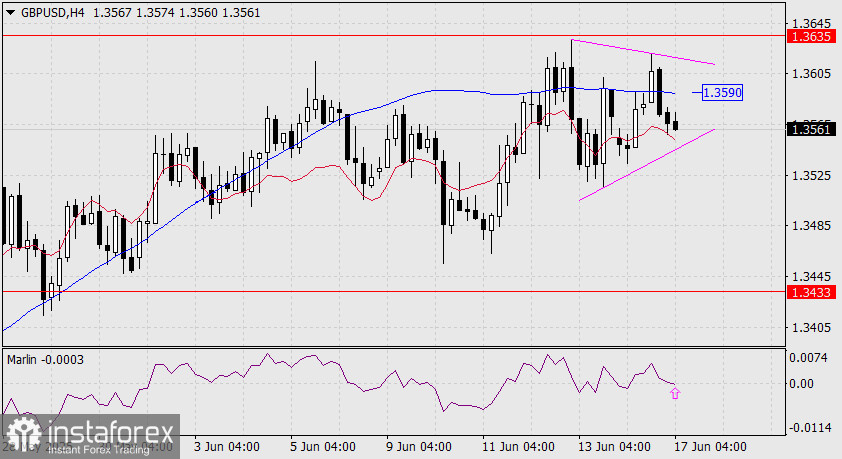
The Marlin oscillator's signal line shows an intention to turn upward from the zero line, which is an additional sign of a possible pound rally.

Today, the U.S. will release May retail sales data (forecast: -0.6% after a modest 0.1% increase in April) and industrial production data (expected at 0.0% growth). Such figures could help prevent the pound from falling in the short term.

Laurie Bailey,
Analytical expert of InstaTrade
© 2007-2025

Recommended Stories

EUR/USD Forecast for August 12, 2025

With support from the stock market decline (S&P 500 –0.25%), the euro fell by 25 pips yesterday, breaking below the 1.1632 support level. If today closes below this level

Laurie Bailey 04:53 2025-08-12 UTC+2

GBP/USD Forecast for August 12, 2025

The British pound only managed to pierce the intermediate level of 1.3452 with its upper shadow. The day closed with a 22-pip loss. The Marlin oscillator's signal line is moving

Laurie Bailey 04:53 2025-08-12 UTC+2

USD/JPY Forecast for August 12, 2025

Yesterday, the USD/JPY pair broke above the signal level of 148.03 (the June 23 high). Today's session opened above this level, and at the same time, the Marlin oscillator's signal

Laurie Bailey 04:53 2025-08-12 UTC+2

XAU/USD. Analysis and Forecast

On Monday, intraday declines pushed gold prices below the 3365 level, but oscillators on the daily chart have not yet started to gain negative momentum. This suggests that the precious

Irina Yanina 19:34 2025-08-11 UTC+2

Trading Signals for EUR/USD for August 11-15, 2025: sell below 1.1650 (200 EMA - 7/8 Murray)

Early in the American session, the euro is trading around 1.1590. After a failed breakout of the downtrend channel, EUR/USD fell below the 21 SMA and below the 7/8 Murray

Dimitrios Zappas 17:54 2025-08-11 UTC+2

Trading Signals for GOLD (XAU/USD) for August 11-15, 2025: sell below $3,380 or buy if rebound 3,341 (21 SMA - 7/8 Murray)

The eagle indicator is showing a negative signal, so we must be very cautious if we are buying, as the bearish force is likely to intensify in the coming hours

Dimitrios Zappas 17:51 2025-08-11 UTC+2

Forecast for EUR/USD on August 11, 2025

On Friday, EUR/USD made two rebounds from the 1.1637–1.1645 support zone and turned in favor of the euro. This means the upward movement could continue today toward the 76.4% Fibonacci

Samir Klishi 10:44 2025-08-11 UTC+2

Forecast for GBP/USD on August 11, 2025

On the hourly chart, GBP/USD on Friday made two rebounds from the 1.3425 level, and on Monday continues moving upward toward the 76.4% retracement level at 1.3470. A rebound from

Samir Klishi 10:25 2025-08-11 UTC+2

Forex forecast 11/08/2025: EUR/USD, USD/JPY, GBP/USD, Gold, Ethereum and Bitcoin

Useful links: My other articles are available in this section InstaForex course for beginners Popular Analytics Open trading account Important: The begginers in forex trading need to be very careful

Sebastian Seliga 10:20 2025-08-11 UTC+2

GBP/USD. Technical Analysis for the Week of August 11–16

Trend Analysis This week, from the 1.3450 level (close to the last weekly candle), the price may start moving downward toward 1.3270 – a historical support level (blue dotted line)

Stefan Doll 10:02 2025-08-11 UTC+2
Can't speak right now?
Ask your question in the chat.
 

Dear visitor,

Your IP address shows that you are currently located in the USA. If you are a resident of the United States, you are prohibited from using the services of InstaFintech Group including online trading, online transfers, deposit/withdrawal of funds, etc.

If you think you are seeing this message by mistake and your location is not the US, kindly proceed to the website. Otherwise, you must leave the website in order to comply with government restrictions.

Why does your IP address show your location as the USA?

  • - you are using a VPN provided by a hosting company based in the United States;
  • - your IP does not have proper WHOIS records;
  • - an error occurred in the WHOIS geolocation database.

Please confirm whether you are a US resident or not by clicking the relevant button below. If you choose the wrong option, being a US resident, you will not be able to open an account with InstaTrade anyway.

We are sorry for any inconvenience caused by this message.