See also

 18.06.2025 03:56 AM
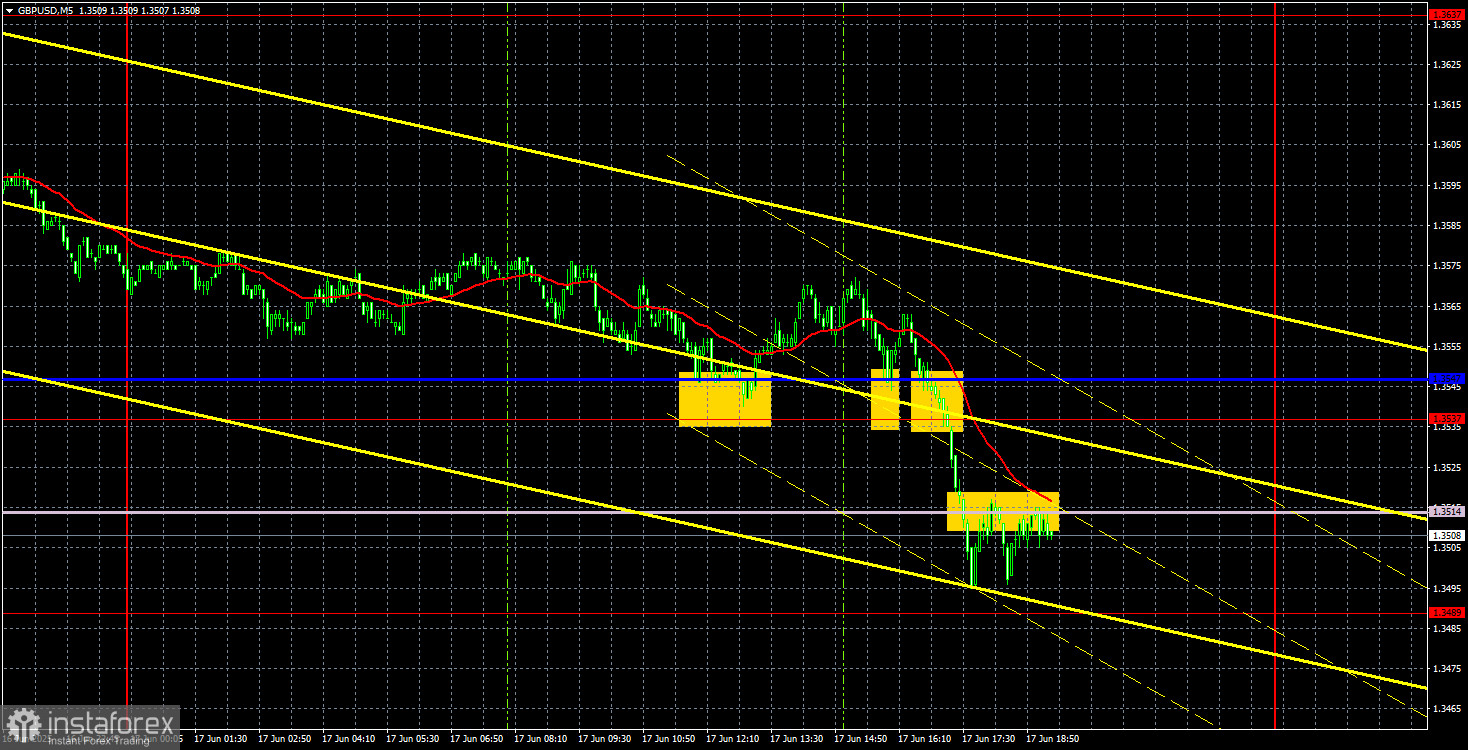
On Tuesday, the GBP/USD currency pair showed a relatively strong intraday decline, although there were no real reasons for it. In fact, the macroeconomic data from the U.S. was weak — if not outright disappointing — but the market once again ignored the reports. This time, however, in favor of the U.S. dollar, which rarely happens. Donald Trump made no important statements during the day and nothing related to de-escalating the Global Trade War. So, there were no grounds for the dollar's rise — highlighting yet again the market's unpredictability.
We believe Tuesday's dollar strength could only be linked to the upcoming Federal Reserve meeting. It's hard to say why the market started buying the dollar exactly 24 hours before the official announcement, but there could be various reasons. For example, the market might be staging a setup ahead of new dollar sell-offs — pushing the dollar higher to allow for more profitable selling later. Market makers often employ these kinds of price manipulations. It's also possible that large players received insider information pointing to a hawkish tone from the Fed this evening.
In the 5-minute timeframe, the most relevant trading signals were formed during the U.S. session. The price bounced twice from the 1.3537–1.3547 area, but those signals were false. Once this area was broken, the real movement began. The pair easily broke through the Senkou Span B line, so a short trade could have yielded solid profit. However, when switching to the 4-hour timeframe, it becomes clear that the pair remains in a "high-level flat."
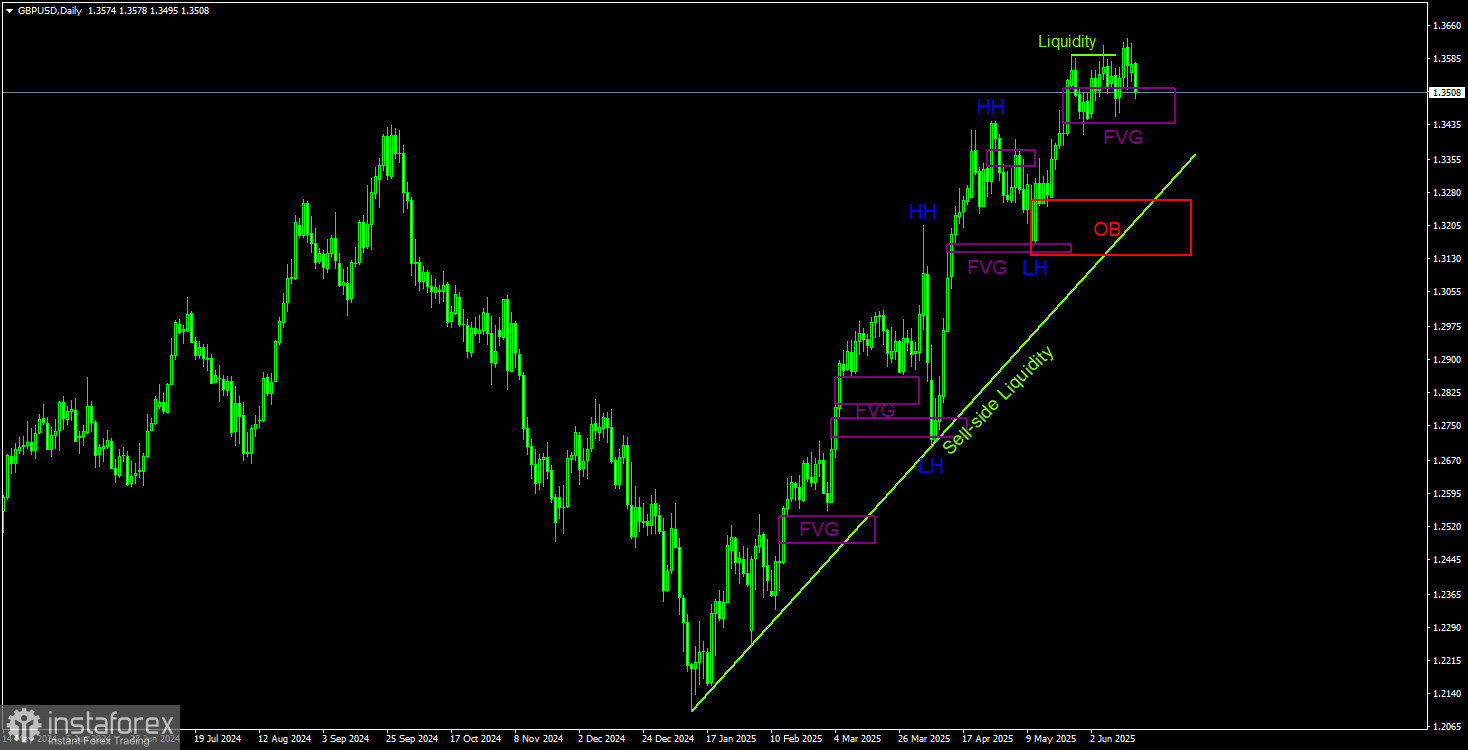
We also observe a strong uptrend in the daily timeframe under the ICT system. Tuesday's decline should not discourage traders — it may have simply been a liquidity grab to set up new buying opportunities. The pair has two local lows, from which it would be ideal to collect liquidity before resuming upward movement. Since there was no fundamental reason for the dollar strengthening on Tuesday, we lean toward labeling the move as price manipulation. The last bullish Fair Value Gap (FVG) has already been worked out and reacted to, so it's now irrelevant. Below is a bullish Order Block, which could serve as a point of decline before the uptrend resumes. At this point, any dollar strength looks highly questionable.
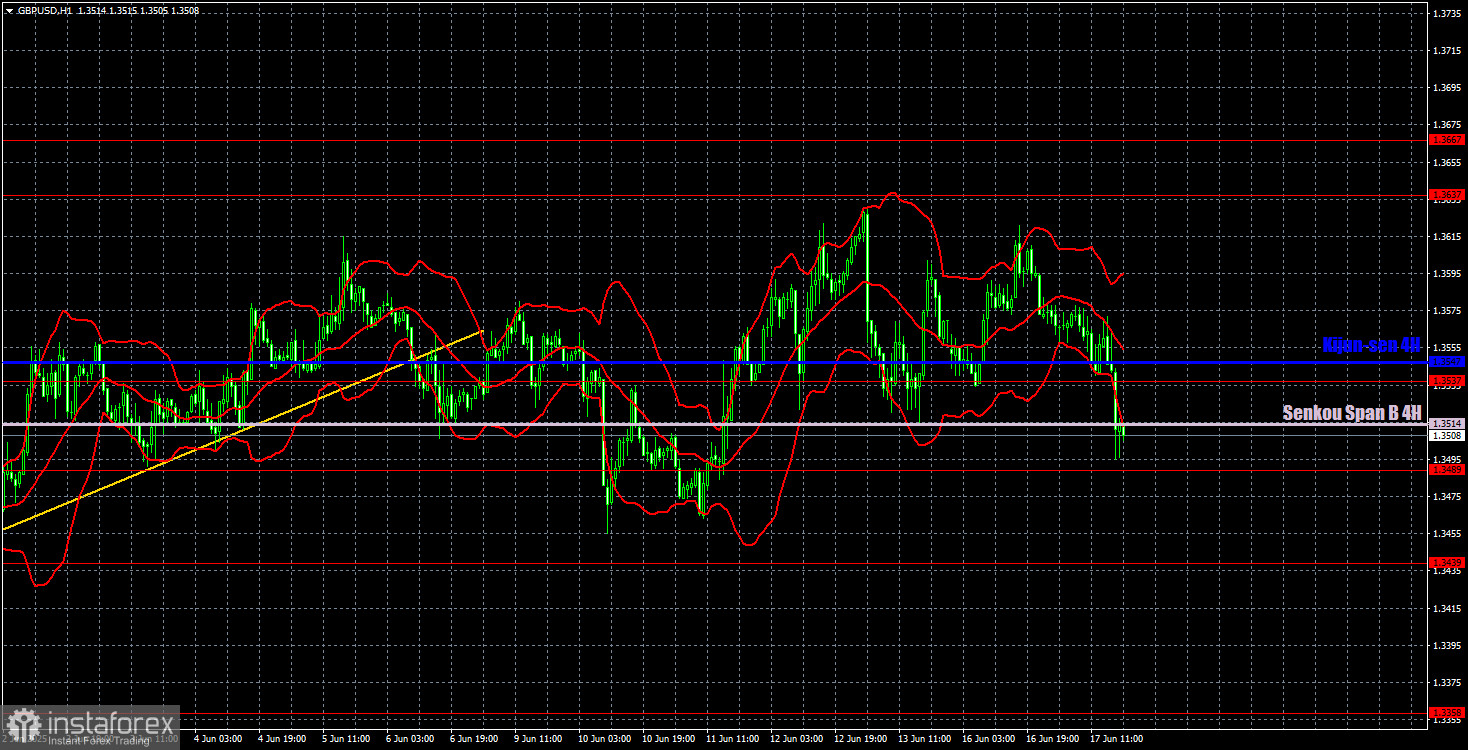
In the hourly timeframe, the GBP/USD pair is no longer trending upward but moving sideways. The U.S. dollar occasionally shows corrections, but the market remains biased toward buying in the medium term. Before the Fed meeting, the dollar slightly strengthened its position, though the reasons remain unclear. We'll find out more tonight. The current technical picture is best viewed on the 4-hour chart—clearly a flat market.
For June 18, we identified the following key trading levels: 1.3050, 1.3125, 1.3212, 1.3288, 1.3358, 1.3439, 1.3489, 1.3537, 1.3637–1.3667, and 1.3741. The Senkou Span B (1.3514) and Kijun-sen (1.3547) lines can also serve as signal indicators. Setting a Stop Loss to break even once the price moves 20 pips in the right direction is recommended. Remember that Ichimoku lines may shift throughout the day, which should be considered when identifying trading signals.
On Wednesday, a key inflation report will be released in the UK, and the Fed meeting will take place in the U.S. Therefore, the morning and evening sessions may bring strong movements and sharp reversals. The dollar could theoretically continue to rise, but it's still very unclear what triggered this move in the first place. That said, trading based on technical signals — which continue to form — remains a viable approach.


