See also

 30.06.2025 10:57 AM
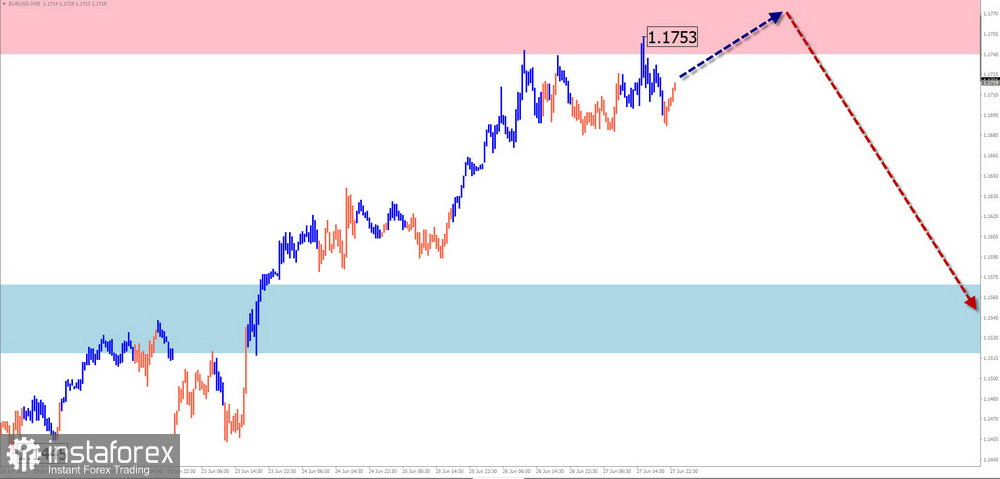
EUR/USD
Analysis:
Since February of this year, the price movement of the euro has followed an upward wave algorithm. Since mid-April, a hidden correction has been forming within the structure. Trendlines drawn through the extremes form a "horizontal pennant" figure, which remains incomplete. The price has reached the lower boundary of a strong potential reversal zone.
Forecast:
In the coming days, a continuation of the sideways flat movement is expected. Near the resistance zone, a reversal setup is likely. A new downward vector is expected to begin by week's end.
Potential Reversal Zones
Recommendations:
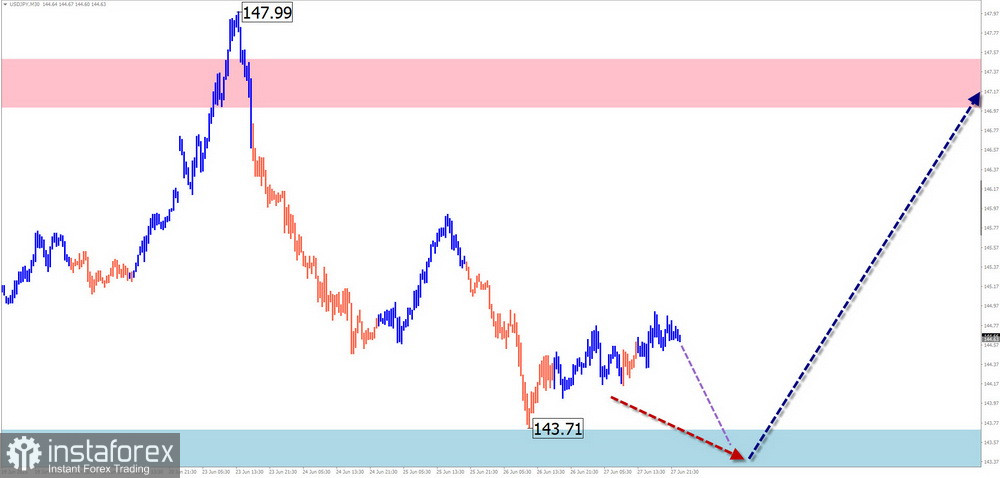
USD/JPY
Analysis:
Since December last year, USD/JPY has followed a dominant downward wave, which remains incomplete. In the past month, the final part (wave C) has begun to form. The wave is developing in a sideways formation.
Forecast:
Sideways movement is expected to continue throughout the week. A brief decline early in the week cannot be ruled out, but it is likely to stay within support boundaries. In the second half of the week, the probability of a trend reversal and price increase toward the resistance zone increases.
Potential Reversal Zones
Recommendations:
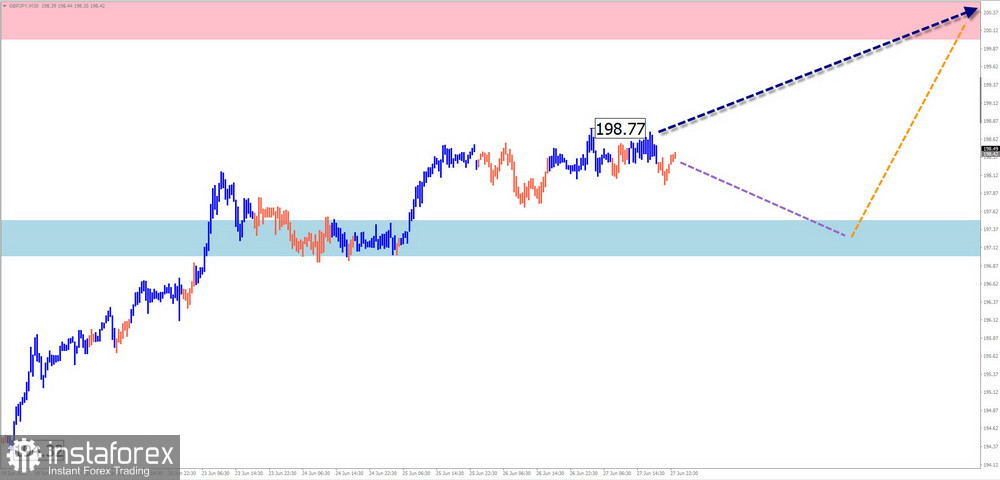
GBP/JPY
Analysis:
Since April, GBP/JPY has been moving within an upward wave. Prices are approaching the lower boundary of a major potential reversal zone on the weekly timeframe. The structure analysis indicates it is still incomplete.
Forecast:
The upward trend is expected to continue during the week, potentially reaching the resistance zone. Sideways movement or a brief decline within the support level is possible in the near term. Increased activity is anticipated toward the end of the week.
Potential Reversal Zones
Recommendations:
USD/CAD
Analysis:
The downward wave that formed on the USD/CAD chart this year has been followed by a corrective move since late May. The pair is largely confined to a sideways price channel. The current wave structure remains incomplete, lacking its final segment.
Forecast:
The pair may decline further in the coming days, reaching the support zone. A reversal and upward movement from support may follow. The resistance zone reflects the upper boundary of the pair's expected weekly volatility.

Potential Reversal Zones
Recommendations:
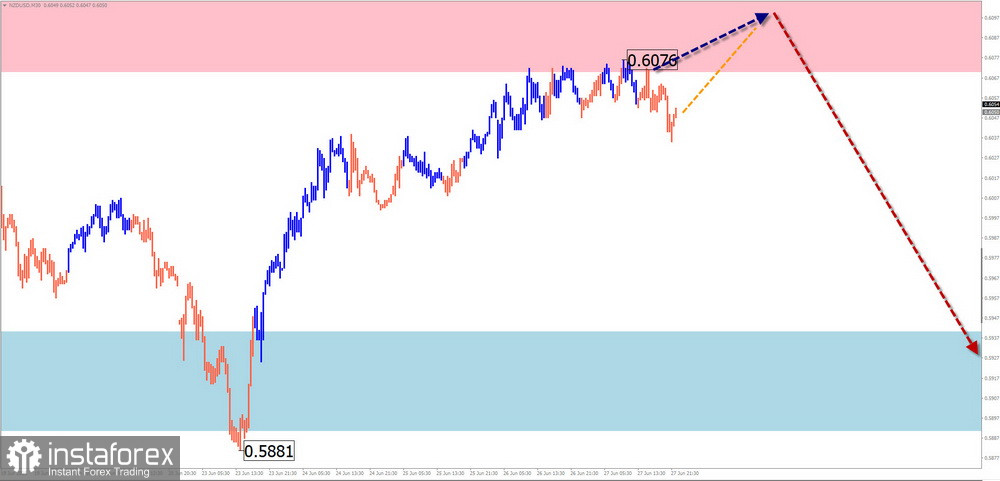
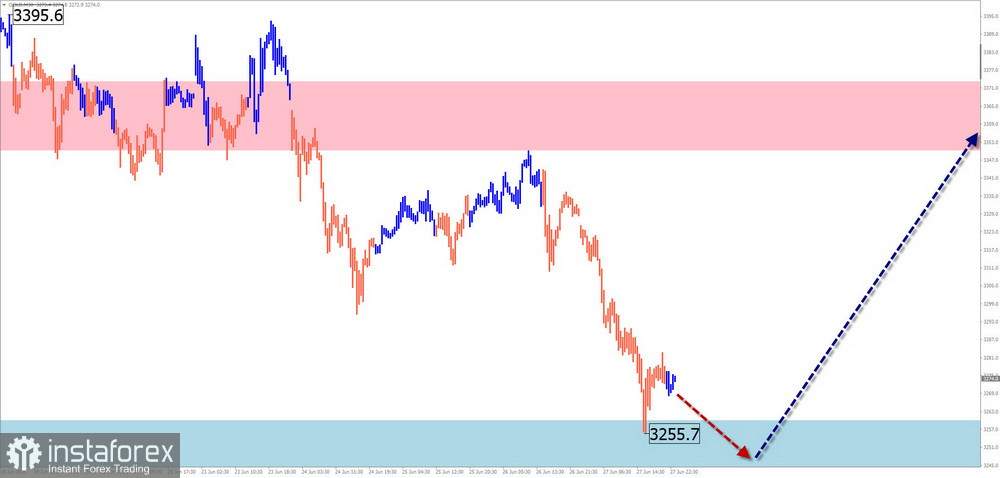
NZD/USD
Brief Analysis:
NZD/USD remains in a dominant bullish wave that began in April. Wave extremes form a "horizontal pennant" on the chart. The bearish phase since May 26 remains a part of internal correction. The bullish leg from June 23 has reversal potential.
Weekly Forecast:
The pair is likely to continue its upward movement for a few more days. A sideways trend and reversal conditions are expected near the resistance zone. Downward movement becomes more probable in the second half of the week.
Potential Reversal Zones
Recommendations:
GOLD
Analysis:
Since April, gold has mostly moved sideways. The current descending phase serves as a correction to the previous bullish trend and forms a "horizontal pennant." The price is testing the upper boundary of the two-month range.
Forecast:
Pressure on the support zone may ease in the coming days. A reversal and renewed price rise could follow. Most of the price activity is expected closer to the weekend.
Potential Reversal Zones
Recommendations:
Notes:In simplified wave analysis (SWA), all waves consist of three segments (A-B-C). Each timeframe analyzes the last, incomplete wave. Dotted lines show expected movement paths.
Important:The wave algorithm does not account for the time duration of price movements!


