
See also


 08.10.2026 08:32 AM
The 4-hour (H4) chart for Bitcoin (#Bitcoin) shows a sharp, sudden price drop; it is currently trading at the 82,927.01 level following a break of the ascending sub-channel structure and a breach of successive key support levels.
Technical Analysis and Price Action
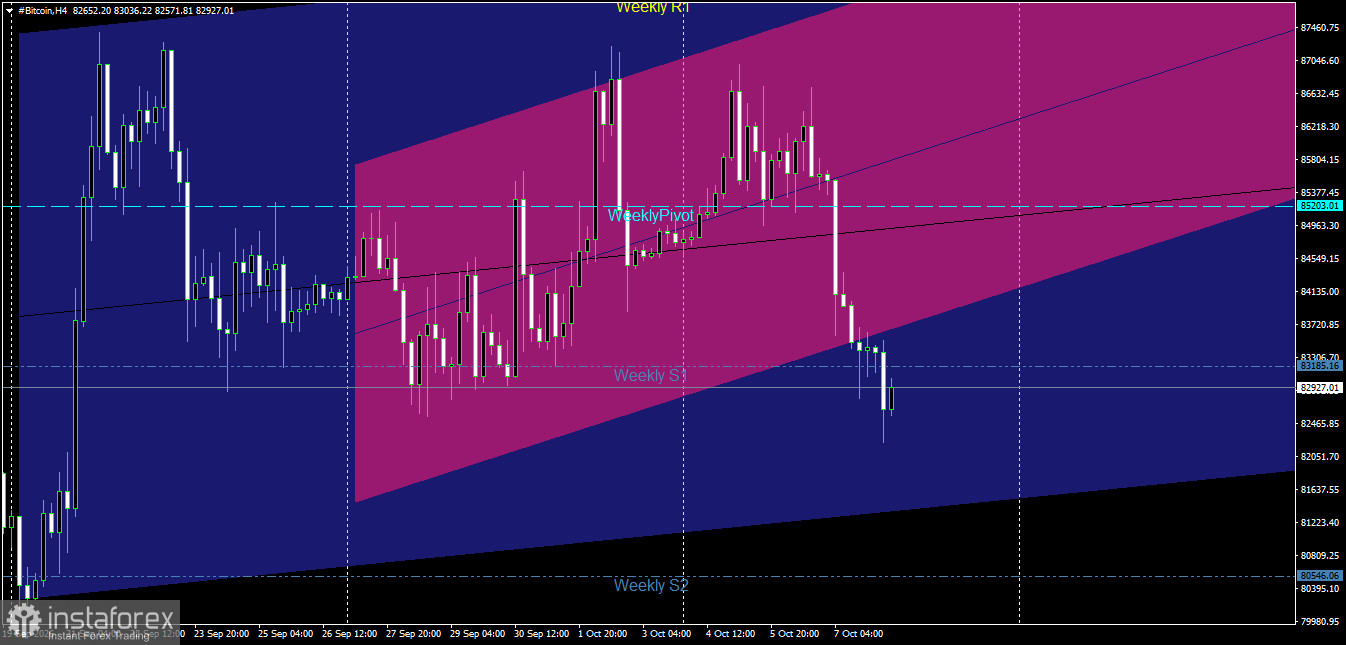
Ascending Channel Break: The price has fully exited the ascending sub-channel (marked in pink/red), which had previously contained the upward movement. This breakout followed the formation of a double top near the daily/weekly resistance line—specifically above the Weekly Pivot level at 85,203.01.
Loss of Pivot Points: The price slid sharply toward lower levels, breaking directly below the Weekly Pivot at 85,203.01. The decline extended past the first weekly support level (Weekly S1) at 83,185.16; the price is currently trading below this level, effectively turning it into immediate resistance.
Key Support and Resistance Levels
Key Resistance Levels:
Resistance 1: 83,185.16 (formerly the Weekly S1 support level).
Resistance 2: 85,203.01 (Weekly Pivot).
Pivotal Resistance: 87,460.00 – 87,842.00 (Weekly R1 resistance level). Key Support Levels:
First Support: 82,465.85 – 82,051.70 (recent intraday low range near the midpoint of the main channel).
Second Support: 80,546.06 (Weekly S2 support level and the lower boundary of the main channel).
Key Support: 79,980.95 (technical support level and a pivotal previous low).
Price Action Outlook and Scenarios
Bearish Scenario (Primary):
A negative trajectory is the most likely scenario in the intraday and medium term, provided the price continues to trade below the 83,185.16 level and outside the rising channel.
Expected Path: Retesting the 83,185.16 level, followed by a resumption of the decline to target the 82,051.70 support zone as a first target; should selling pressure persist, the pullback would extend toward the Weekly S2 support at 80,546.06.
Bullish Corrective Scenario (Alternative):
This scenario is triggered only if buyers manage to push the price back above the 83,185.16 level and close with a strong 4-hour candle above it.
Expected Path: Entering a bullish corrective wave aimed at retesting the weekly pivot at 85,203.01.
The H1 chart for Bitcoin (#Bitcoin) shows a continuing bearish price trend; the price is currently trading around the 82,918.06 level, approaching new lows within a clear downtrend defined by regular price channels.
Technical Analysis and Price Action
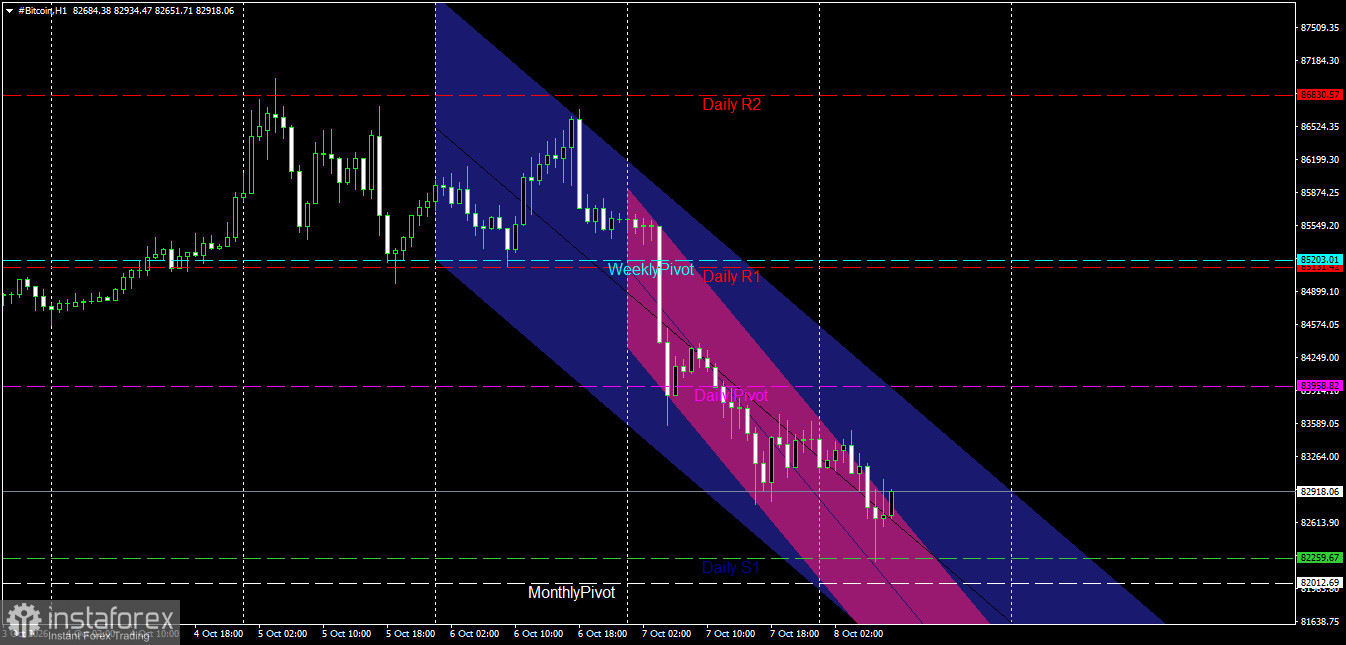
Bearish Price Channel Structure: Bitcoin is clearly moving within a primary bearish channel (blue) that reflects the prevailing intraday trend, overlaid by a steeper, more aggressive bearish sub-channel (pink/red). The price is tracking close to the midline and lower boundary of the sub-channel, indicating dominant selling pressure.
Trading Below Pivot Points: The price faces significant bearish pressure, trading below the Weekly Pivot (85,203.01) and the first daily resistance level (Daily R1 at 85,151.42). It has also decisively broken below the Daily Pivot (83,958.82); this level has now shifted into an intraday resistance zone, hindering attempts at a corrective rebound.
Key Support and Resistance Levels
Key Resistance Levels:
Resistance 1: 83,958.82 (Daily Pivot).
Resistance 2: 85,151.42 – 85,203.01 (Weekly Pivot and Daily R1). Key Resistance: Level 86,830.57 (Daily R2).
Key Support Levels:
First Support: Level 82,259.67 (Daily S1).
Second Support: Level 82,012.69 (Monthly Pivot).
Main Support: Level 81,638.75 (Lower boundary of the main price channel).
Price Action Outlook and Scenarios
Bearish Scenario (Primary):
A bearish trend is considered most likely in the short term as long as trading remains below the 83,958.82 level.
Expected Path: A continued slide toward the first daily support level (82,259.67) is expected as a near-term target. A break below this level would target the monthly pivot (82,012.69), with the potential for further extension toward 81,638.75, near the channel's lower boundary.
Bullish Corrective Scenario (Alternative):
This requires a clear breakout above the daily pivot point (83,958.82) and stabilization above it, confirmed by a strong hourly candle.
Expected Path: Entry into a corrective wave targeting a retest of the resistance zone between 85,151.42 and 85,203.01.
Risk Management
Trading on short timeframes amidst a dominant bearish trend requires extreme caution. It is advisable to adhere to stop-loss orders placed above nearby resistance levels and to avoid buying against the trend until confirmed reversal signals appear.


