See also

 07.07.2025 01:20 PM
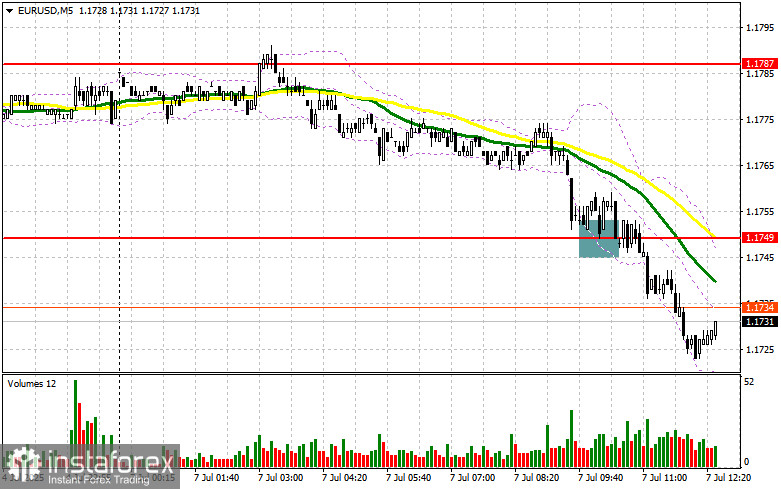
To open long positions on EUR/USD:
Strong data on German industrial production and an increase in the eurozone investor confidence index from Sentix failed to help the euro maintain its leading position against the U.S. dollar. This suggests that pressure on the euro is mounting due to the lack of a U.S.–EU trade deal, and the closer we get to the July 9 deadline, the stronger this pressure may become. Unfortunately, there are no U.S. statistics scheduled for release in the second half of the day, so a continued decline in EUR/USD cannot be ruled out.
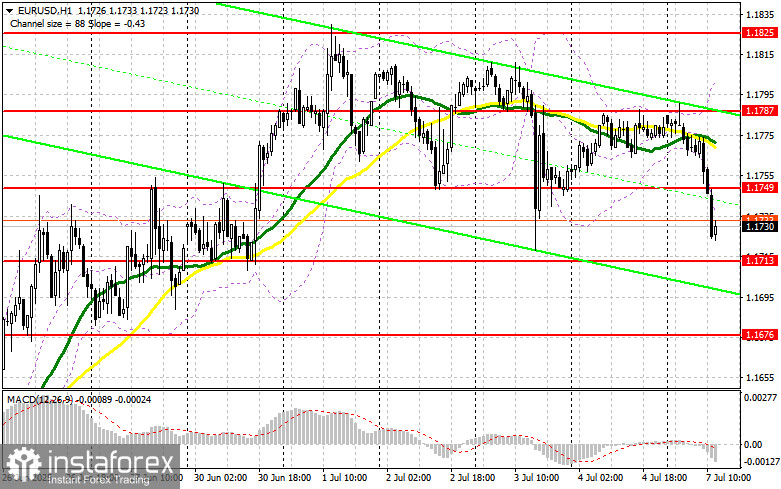
If the pair falls, buyers will focus on the support level at 1.1713. A false breakout there will serve as a signal to buy EUR/USD in anticipation of a return to bullish momentum and a retest of 1.1749, which earlier acted as support. A breakout and retest of this level would confirm a valid entry point, with a target at 1.1787. The ultimate target will be 1.1825, where I plan to take profit. If EUR/USD declines and shows no activity near 1.1713, pressure on the pair will intensify, potentially leading to a deeper drop. In this case, bears could push the pair down to 1.1676. Only after a false breakout there will I consider buying the euro. Alternatively, I plan to open long positions on a bounce from 1.1634 with a target of a 30–35 point intraday upward correction.
To open short positions on EUR/USD:
Sellers continue to put pressure on the euro and are doing so quite effectively. But to confirm the presence of large players in the market, resistance at 1.1749 needs to hold. I will act only after a false breakout forms there, targeting a drop toward 1.1713. A breakout and consolidation below that range would be an ideal sell signal with a move toward 1.1676. The ultimate target will be the 1.1634 level, where I plan to take profit.
If EUR/USD rises in the second half of the day and bears show no activity around 1.1749—just above which lie the moving averages that currently favor the bears—buyers may regain the initiative and push for a retest of 1.1787. I will sell there only after a failed breakout. Alternatively, I plan to open short positions on a bounce from 1.1825, targeting a 30–35 point intraday correction.
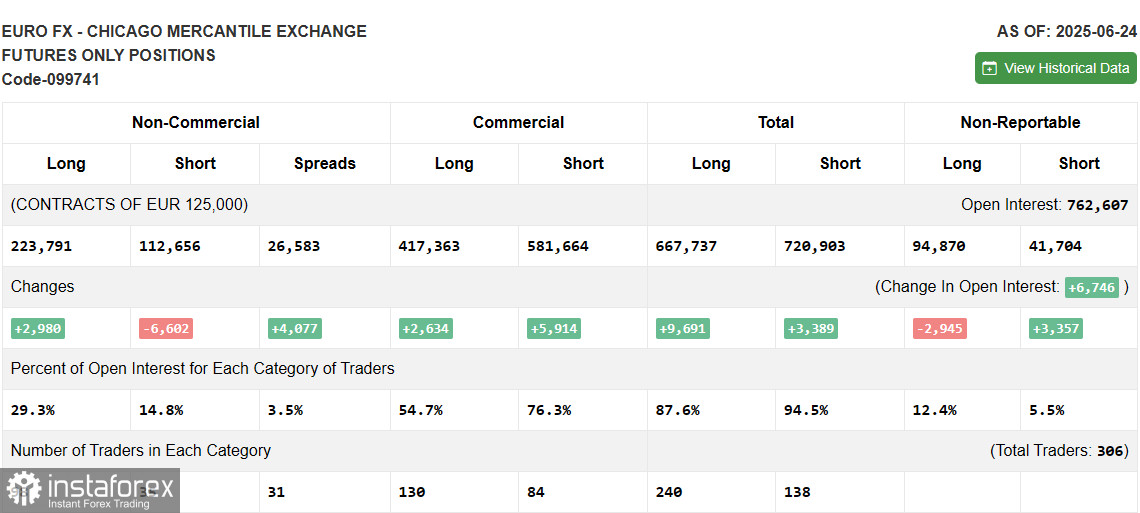
The COT (Commitment of Traders) report for June 24 showed an increase in long positions and a decrease in shorts. The euro continues to be in demand, while the U.S. dollar is losing ground. The latest inflation and GDP data from the U.S. have prompted market participants to revise expectations for an earlier interest rate cut by the Federal Reserve, which continues to exert pressure on the dollar. A series of key U.S. labor market reports are expected soon, which may further confirm the need for a more dovish monetary policy.
According to the COT report, long non-commercial positions rose by 2,980 to 223,791, while short non-commercial positions decreased by 6,602 to 119,258. As a result, the gap between long and short positions increased by 4,077.
Indicator Signals:
Moving AveragesTrading is occurring below the 30- and 50-period moving averages, indicating continued downward pressure on the pair.
Note: The author uses moving average periods and price levels based on the H1 chart, which differs from the standard definitions of daily moving averages on the D1 chart.
Bollinger BandsIn case of a decline, the lower boundary of the indicator around 1.1730 will act as support.
Indicator Descriptions:


