See also

 27.08.2025 10:17 AM
Trend Analysis (Fig. 1).
On Wednesday, the market from the level of 1.3475 (yesterday's daily candle close) may start moving downward, targeting 1.3405 – historical support level (blue dashed line). Upon testing this level, the price may rebound upward, targeting 1.3420 – 38.2% retracement level (yellow dashed line).
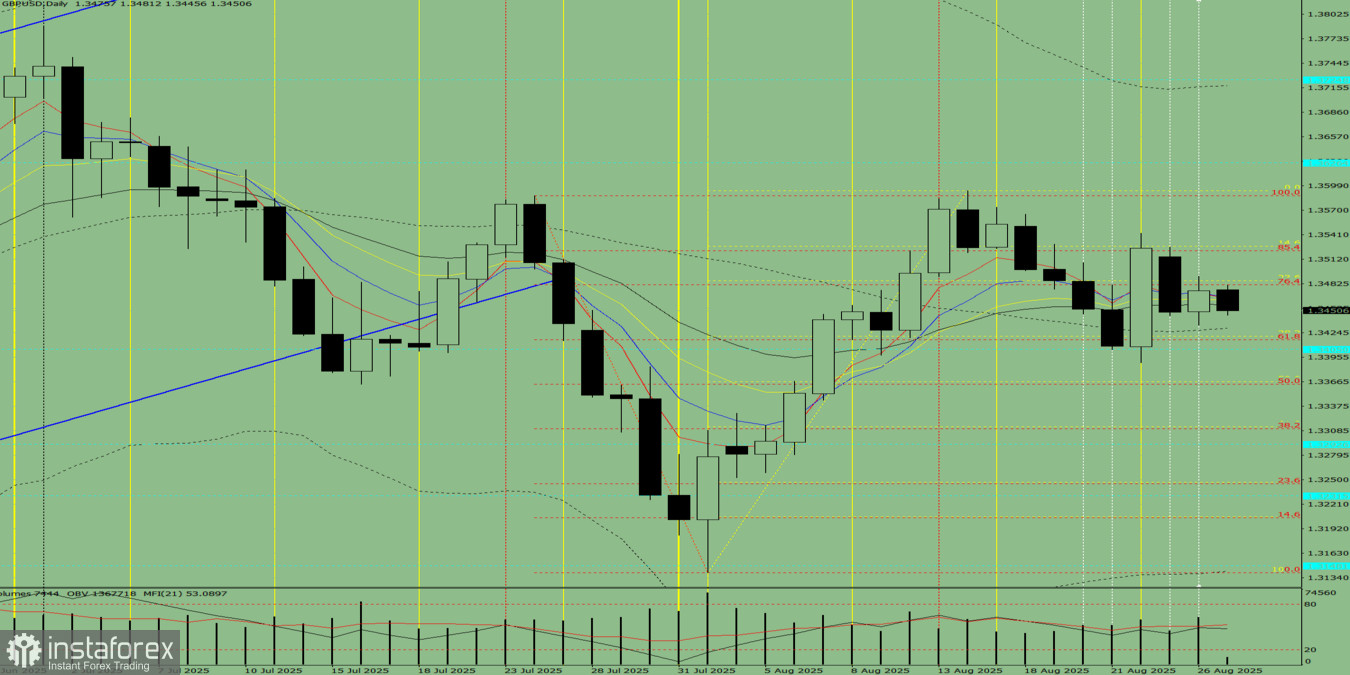
Fig. 1 (daily chart).
Comprehensive analysis:
Overall conclusion: downward trend.
Alternative scenario: On Wednesday, the market from the level of 1.3475 (yesterday's daily candle close) may start moving downward, targeting 1.3363 – 50% retracement level (red dashed line). Upon testing this level, a rebound upward is possible, targeting 1.3405 – historical support level (blue dashed line).
You have already liked this post today
*The market analysis posted here is meant to increase your awareness, but not to give instructions to make a trade.


