See also

 31.10.2025 10:20 AM
On Friday, the market may continue moving downward from the 1.3150 level (the closing price of yesterday's daily candle) toward the 1.3115 target — the lower fractal (daily candle from October 30, 2025). Upon testing this level, a pullback movement upward toward 1.3148 is possible — a historical resistance level (blue dotted line).
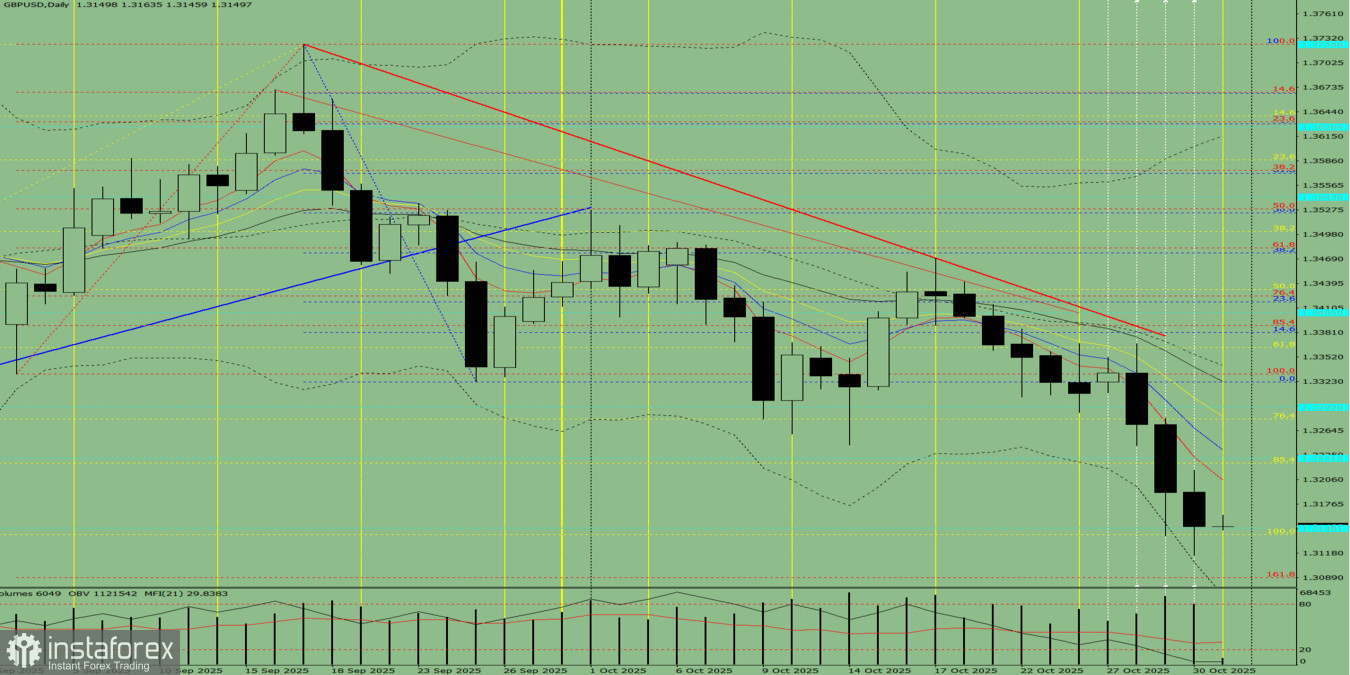
Fig. 1 (Daily Chart)
Overall conclusion: Downward trend.
Alternative scenario:From the 1.3150 level (the closing price of yesterday's daily candle), the price may continue moving downward toward 1.3089 — the 161.8% target level (red dotted line). Upon testing this level, a pullback upward movement toward 1.3115 — the lower fractal (daily candle from October 30, 2025) — is possible.
You have already liked this post today
*The market analysis posted here is meant to increase your awareness, but not to give instructions to make a trade.


