See also

 31.03.2026 04:01 AM
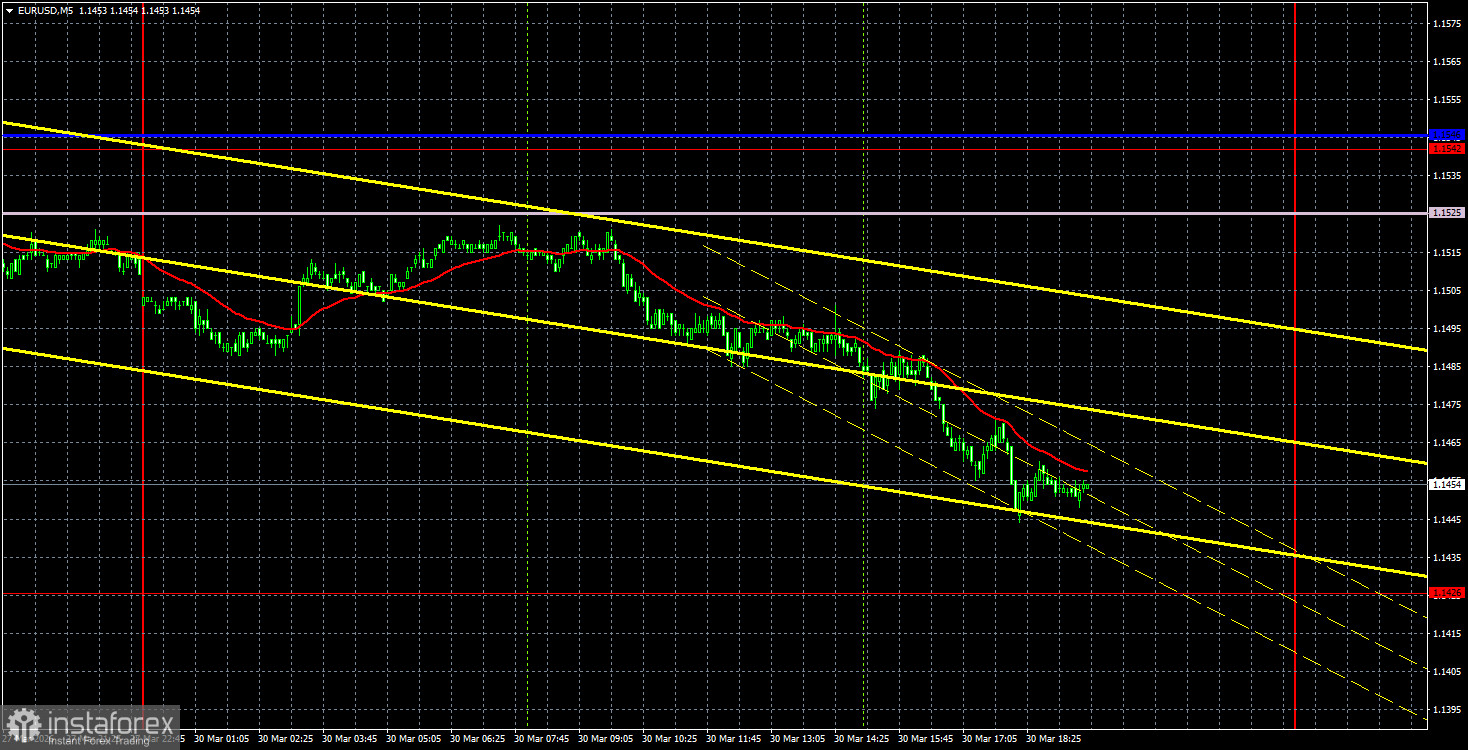
The EUR/USD currency pair continued its downward movement on Monday, as it had for most of the past week. The last five trading days perfectly illustrate what is happening in the world and on the currency market now. Is there any doubt that the sole reason for the rise of the US dollar and the fall of the EUR/USD pair is geopolitics? Moreover, there was no outright bad news from the Middle East over the weekend or on Monday. It's simple: Donald Trump made another statement, leaving traders with only one question: Is the US president joking or is he serious? In one day, Trump warned Iran that if it did not unblock the Strait of Hormuz, he would destroy all energy, wastewater treatment, and other infrastructure in the country and seize the island of Kharg, through which up to 90% of Iranian oil is exported. On the same day, Trump stated that negotiations were progressing successfully and that Tehran had accepted most of Washington's conditions.
From a technical standpoint, the pair's decline remains entirely justified. After surpassing the Ichimoku indicator lines and the trendline, a downturn was only to be expected. The trend has shifted back to bearish, and we have not seen an upward trend even on the hourly timeframe for a long time.
On the 5-minute timeframe on Monday, no trading signals were formed. During the European trading session, the price came within three pips of the Senkou Span B line but did not test it. The margin for the euro was too high to open a short position.
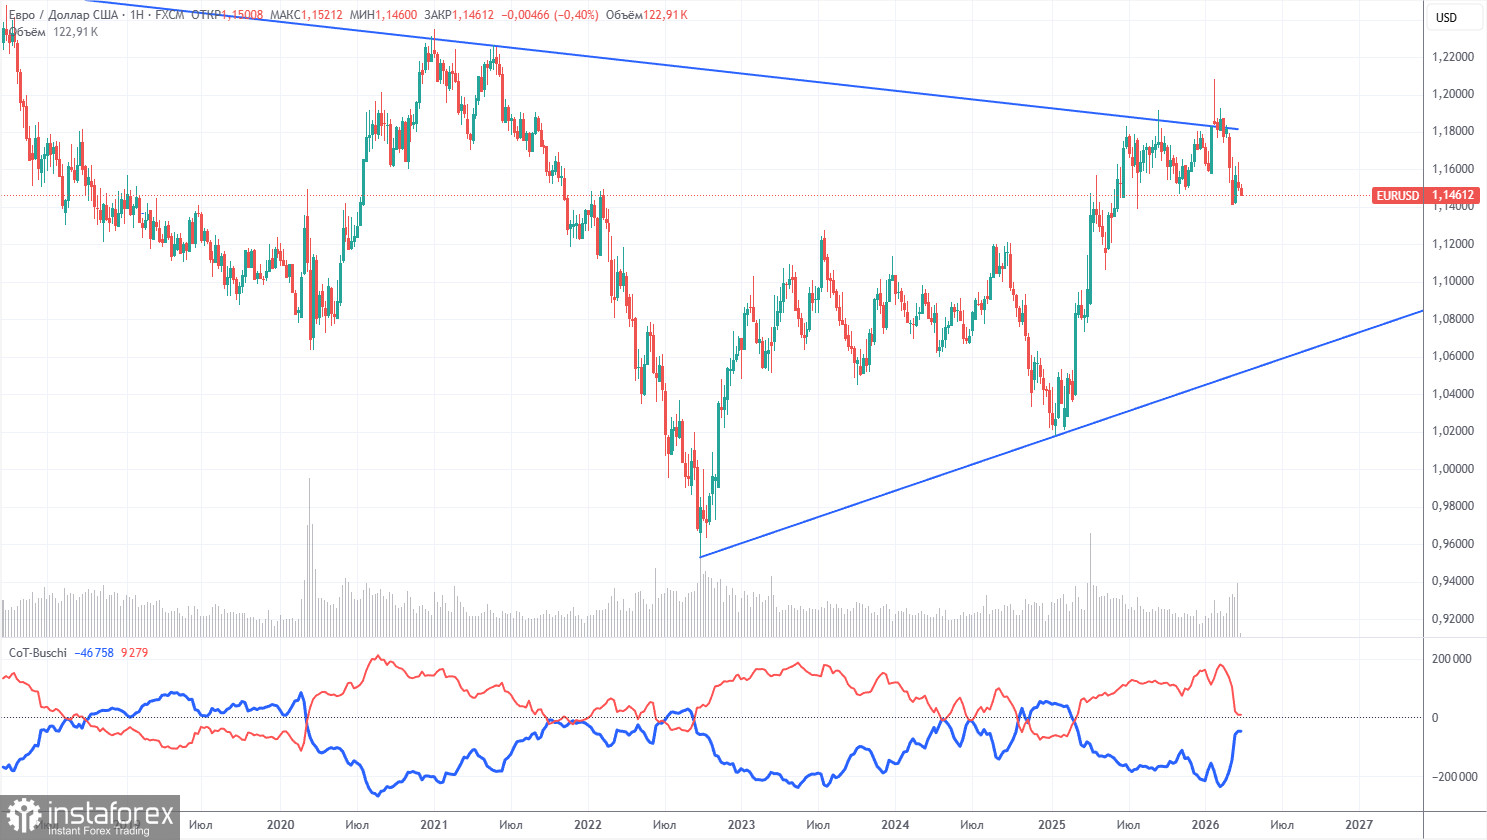
The latest COT report is dated March 24. The illustration for the weekly timeframe clearly shows that the net position of non-commercial traders remains bullish but is rapidly declining amid geopolitical events. Traders are mass-selling the euro in favor of the US dollar. Trump's policies have not changed, but the dollar is once again acting as a "reserve currency," which is driving a sharp influx of buyers.
We still do not see any fundamental factors that would strengthen the euro. However, there are still enough factors driving the decline of the US dollar. The war in the Middle East has made the dollar temporarily super attractive, but when this factor expires, everything may return to normal. In the long term, the euro could fall to 1.06 (the trendline), but the upward trend will remain relevant.
The positioning of the red and blue lines of the indicator continues to indicate the preservation of a bullish trend. Over the past reporting week, the number of longs in the "Non-commercial" group decreased by 12,800, while the number of shorts decreased by 1,000. Consequently, the net position fell by 11,800 contracts in just one week.
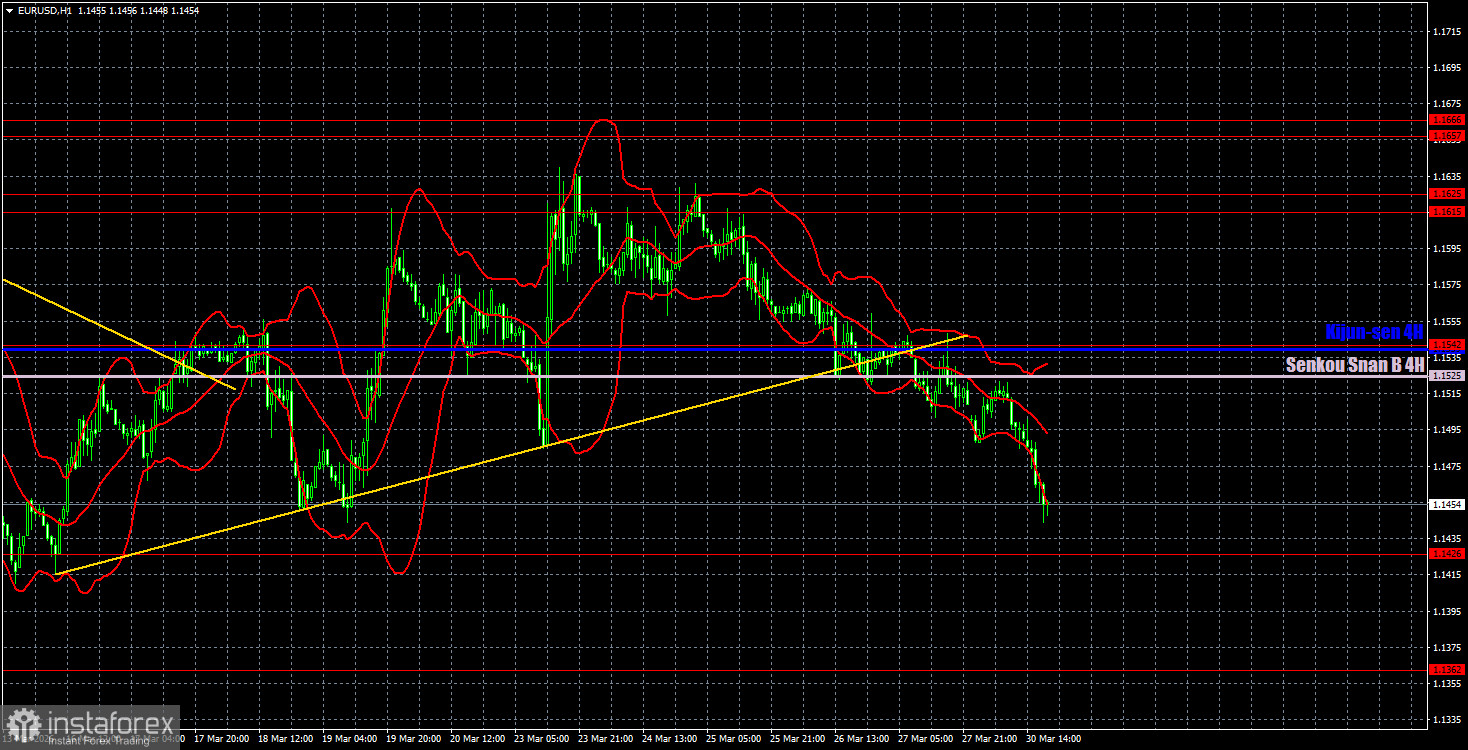
On the hourly timeframe, the EUR/USD pair has begun forming a new descending trend after breaking the trendline. New escalations in the Middle East, new shocks in the oil or gas market, or an expansion of the conflict beyond the Middle East could provoke a new wave of dollar buying, but even without these conditions, the dollar is performing well.
On March 31, we identify the following levels for trading: 1.1234, 1.1274, 1.1362, 1.1426, 1.1542, 1.1615-1.1625, 1.1657-1.1666, 1.1750-1.1760, 1.1830-1.1837, as well as the Senkou Span B line (1.1525) and Kijun-sen (1.1539). The Ichimoku indicator lines may shift during the day, which should be taken into account when determining trading signals. Do not forget to set a stop-loss order at breakeven if the price moves in the right direction by 15 pips. This will protect against potential losses if the signal turns out to be false.
On Tuesday, inflation for March will be published in the Eurozone, which can rightfully be considered the key indicator of the day. However, whether or not the market will react to it is a big question. Inflation in Germany has already jumped to 2.7%, so we are likely to see similar growth across the EU. In April, we expect the ECB to tighten monetary policy.
On Tuesday, traders may consider short positions if the price consolidates below 1.1426, with a target at 1.1362. Long positions can be opened with a target of 1.1525 if the price bounces off 1.1426.


