See also

 05.06.2026 03:45 AM
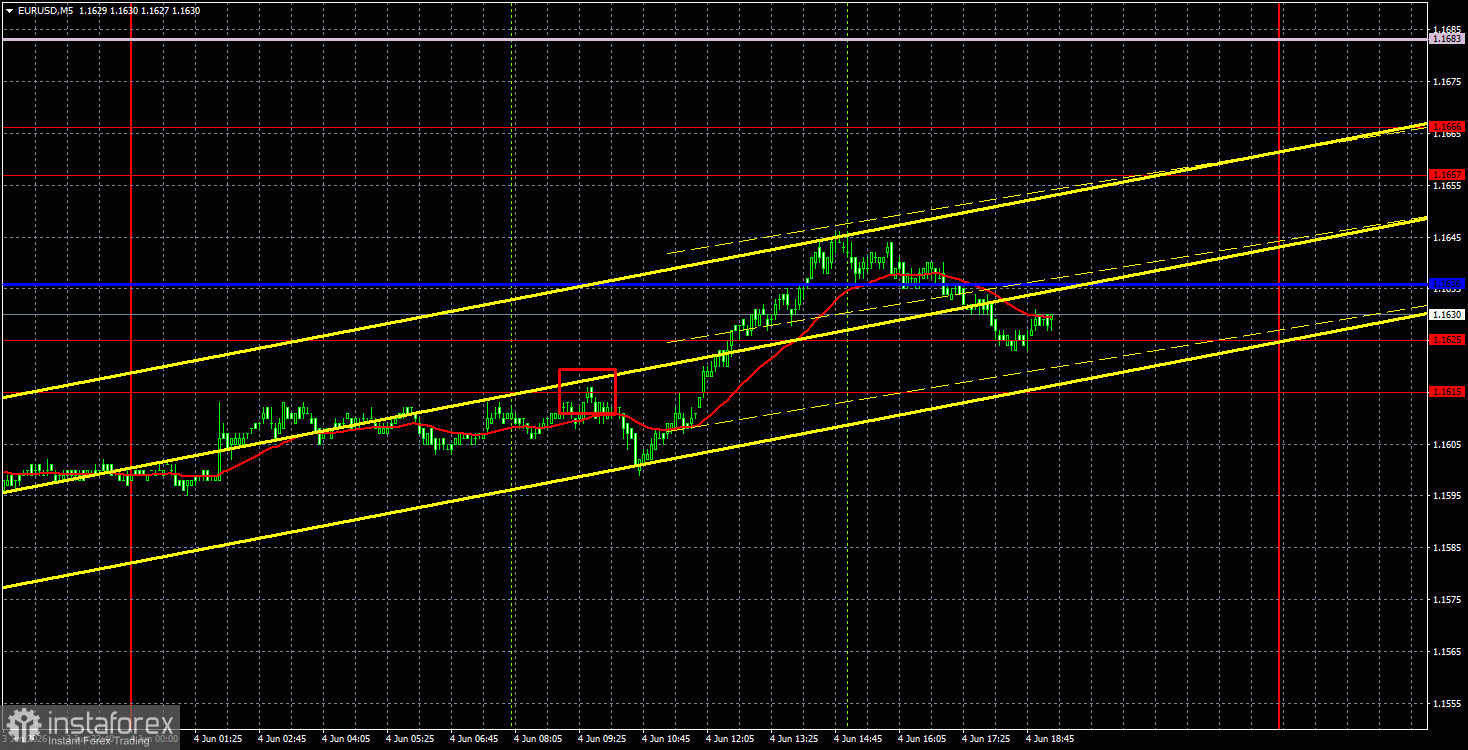
On Thursday, the EUR/USD pair continued to trade within a sideways channel between the level of 1.1585 and the area of 1.1657-1.1666. Thus, the flat market persists, and the nature of the pair's movement does not change day by day. The Ichimoku indicator lines currently lack strength, making it pointless to seek signals around them. Moreover, they are positioned exactly in the middle of the flat channel, near another area of 1.1615-1.1625. Therefore, trading within the current channel is not meaningful— the nearest targets are only 15-20 pips away. The macroeconomic backdrop on Thursday was virtually absent, except for the secondary reports on US jobless claims and Eurozone retail sales. No new geopolitical news surfaced during the day either.
From a technical standpoint, the downward trend persists, as the pair has not been able to initiate an upward movement or breach the 1.1657-1.1666 area over the last three weeks. We are currently witnessing a purely flat movement, which can only be determined to have completed either below 1.1585 or above the area of 1.1657-1.1666. Until that happens, the market remains in complete equilibrium.
On the 5-minute timeframe, several trading signals were formally generated on Thursday. However, only the very first one—the bounce in the area of 1.1615-1.1625—was worthy of attention. This bounce turned out to be false, which is not surprising given the nature of the pair's movement recently.
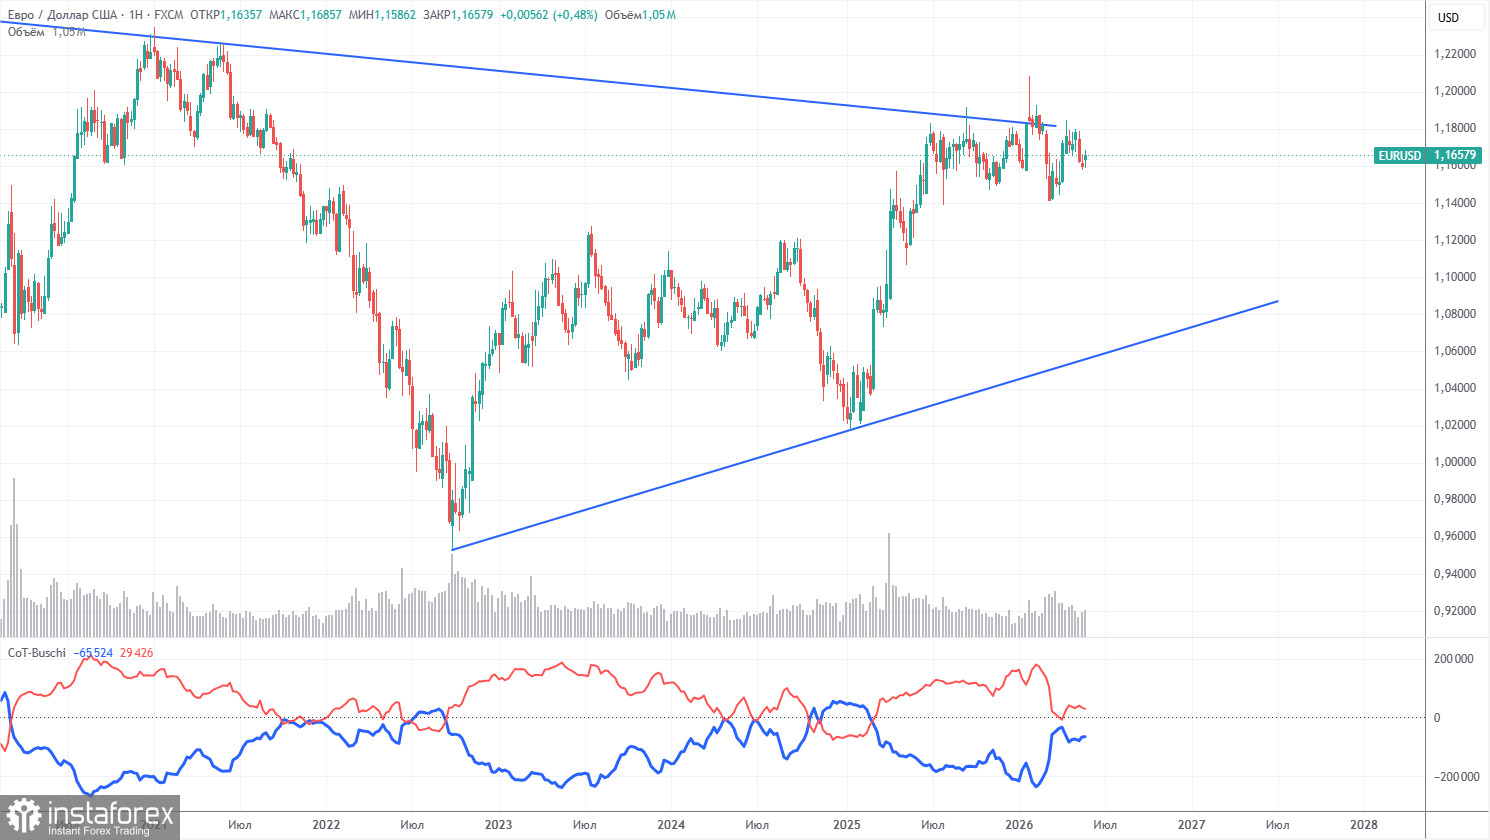
The latest COT report is dated May 26. The weekly timeframe illustration clearly shows that the net position of non-commercial traders remains "bullish," but is rapidly declining due to geopolitical events. Traders have been shedding the European currency in favor of the US dollar in recent months. Trump's policies have not changed, but the dollar has acted as a "reserve currency" for some time. However, this process may now be complete.
We still do not see any fundamental factors for the strengthening of the European currency, while there are sufficient factors for the dollar's decline. The war in the Middle East made the dollar temporarily very attractive, but when this factor reaches its "expiration date," everything will revert to normal. It may have already expired. In the long term, the euro could fall to the level of $1.06 (the trend line), but the upward trend will still remain relevant. Currently, the pair has not deviated significantly from the descending trend line, which has been breached several times.
The positioning of the red and blue lines in the indicator indicates parity between bulls and bears. Over the last reporting week, the number of longs in the Non-Commercial group decreased by 10,200, while the number of shorts decreased by 6,100. Consequently, the net position fell by 4,100 contracts over the week.
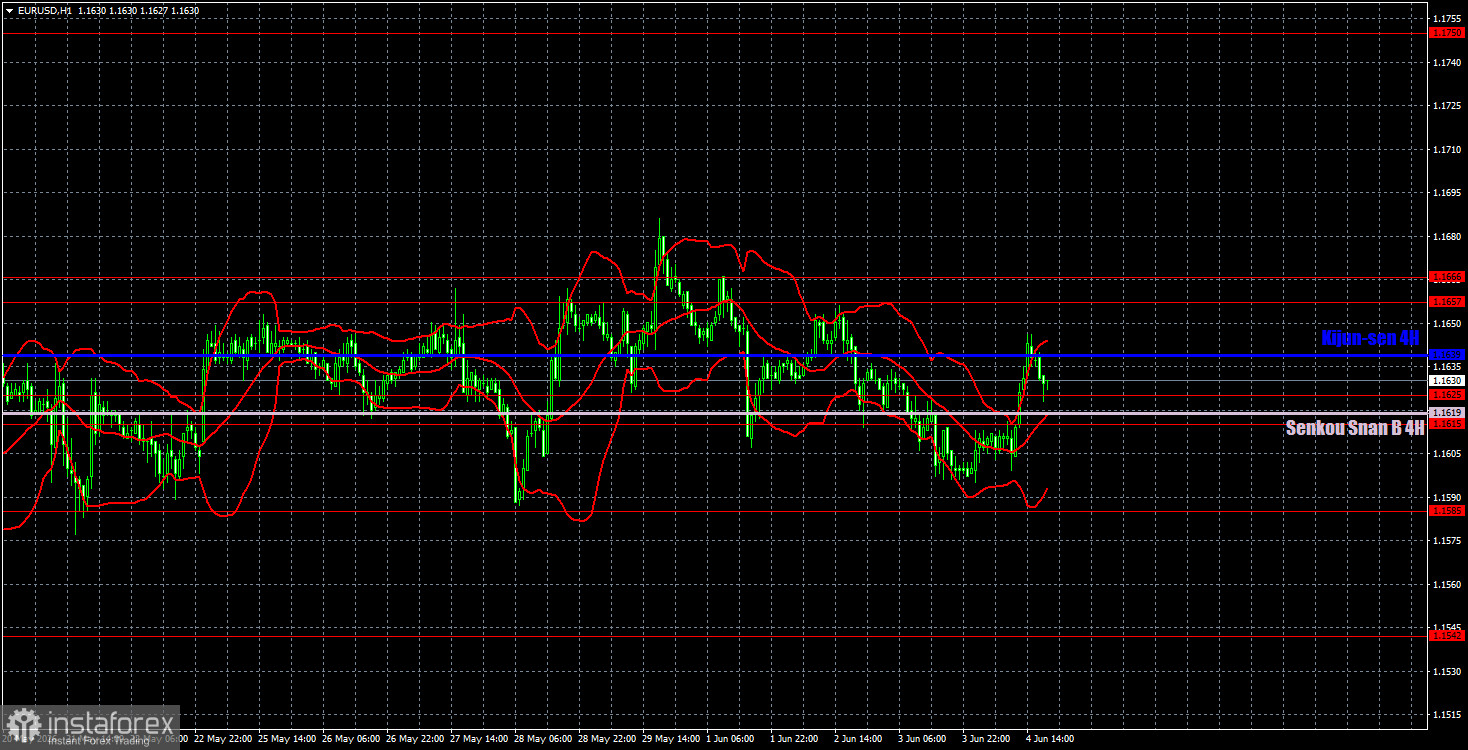
On the hourly timeframe, the EUR/USD pair has been trading in a flat range between the level of 1.1585 and the area of 1.1657-1.1666 for three weeks. The situation in the Middle East remains tense, not worsening, and Washington and Tehran can only dream of signing a preliminary agreement at this point. If no new signs of a resumption of war emerge in the Middle East and the memorandum is indeed signed, the dollar may begin to lose ground. However, we are currently observing neither a deal nor a resumption of hostilities.
For June 5, we highlight the following levels for trading: 1.1362, 1.1426, 1.1542, 1.1585, 1.1615-1.1625, 1.1657-1.1666, 1.1750-1.1760, 1.1786, 1.1830-1.1837, 1.1907-1.1922, as well as the Senkou Span B line (1.1619) and Kijun-sen line (1.1639). The lines of the Ichimoku indicator may shift throughout the day, which should be considered when determining trading signals. Don't forget to set a Stop Loss order to break even if the price moves in the correct direction by 15 pips. This will protect against potential losses if the signal proves false.
On Friday, the second estimate of GDP for the first quarter will be published in the Eurozone, and in the US, important NonFarm Payrolls and unemployment reports. Unfortunately, over the last three months, these reports have only been important on paper. The market continues to ignore the macroeconomic backdrop, including the most significant reports. Therefore, we have no confidence that the labor market data will resonate with traders.
Today, traders may consider short positions targeting the Senkou Span B line and the 1.1585 level if the price bounces from the 1.1657-1.1666 area. Long positions can be opened if there's consolidation above the 1.1657-1.1666 area, targeting 1.1750-1.1760.


