
See also


 30.10.2026 05:55 AM
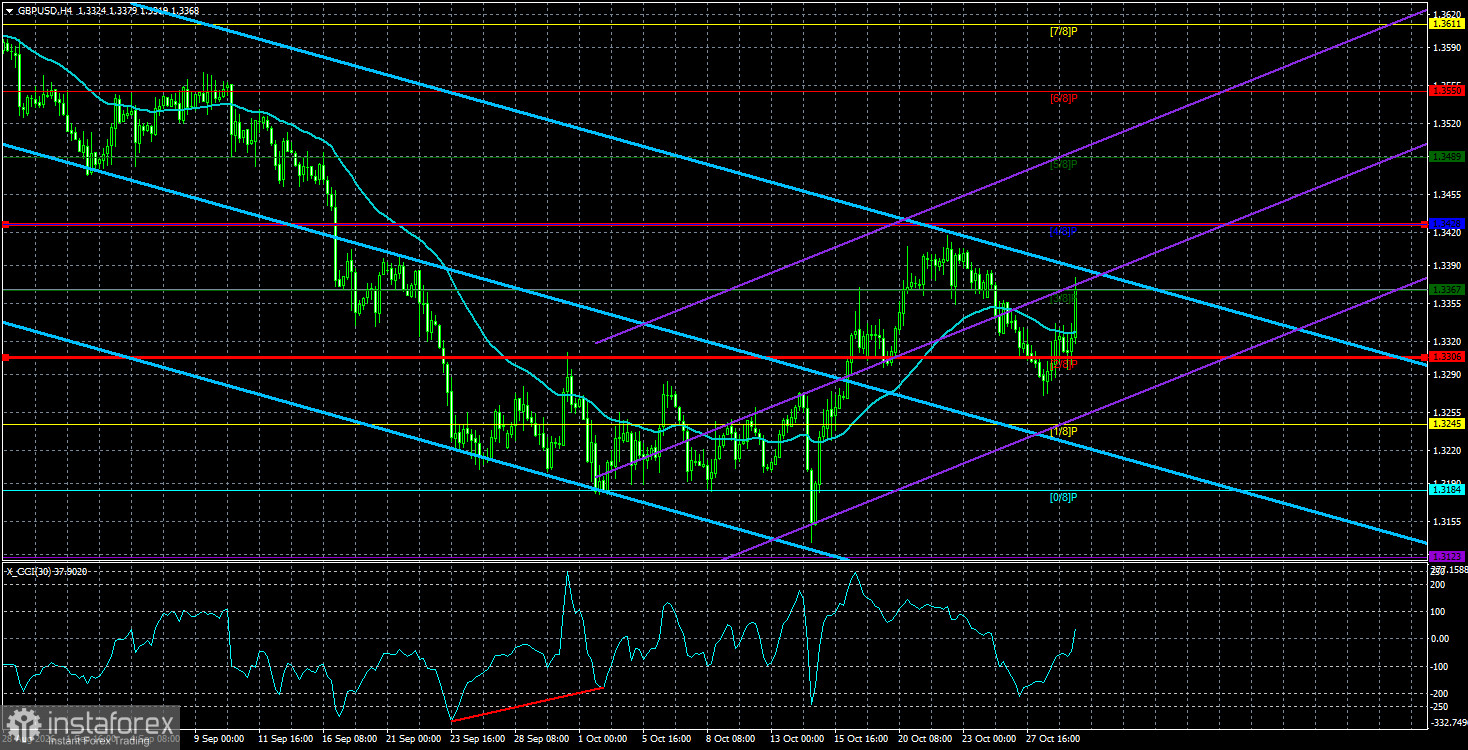
The GBP/USD pair showed no interesting movement during Wednesday evening. Both the euro and the pound rose slightly, with sterling—as has become customary—outperforming the single currency. That is no surprise: we have repeatedly noted that the pound has shown greater resilience versus the U.S. dollar in recent weeks. In effect, the market reacted in a way that makes sense for sterling.
A few key points set the scene ahead of the Federal Reserve meeting.
First, almost no one in the market expected the Fed to tighten policy. That view was clear several weeks ago after FOMC members' speeches. Only a very small number of officials were prepared to vote for a hike in October — and that is what happened: just two of the twelve FOMC members voted to raise the policy rate.
Second, the market has been broadly confident the Fed will raise rates by 25 bp in December; Wednesday's meeting merely confirmed what had already become the baseline. In autumn 2026, the Fed made it clear it is prepared to fight elevated inflation, but it is not seeking an aggressive tightening campaign that would damage the economy or the labor market. Put simply, the Fed intends to raise rates only as far as needed to restart disinflation, not to push them to the maximum possible level.
Third, Kevin Warsh never publicly lays out the central bank's future steps, so expecting him to promise a December hike or a clear roadmap for 2027 on Wednesday was, at best, naive. In short, traders received no materially new information from the meeting.
Now consider the market reaction, which was extremely muted. The dollar eased only slightly—so little that, on the charts, you wouldn't easily spot that a Fed meeting took place this week. The pound's move was entirely logical: no strong fundamental reason drove an immediate rally or drop. The euro, however — which remains at multi-week lows — could have produced a meaningful bounce, since the hawkish December scenario had already been largely priced in. In other words, traders could have at least taken profits on existing dollar longs. They did not.
Conclusion: the pound continues to trade in a more or less orderly, technical fashion. The market continues to sell off the euro despite European Central Bank tightening and other supportive factors. Analysts keep pointing to geopolitics, Fed tightening, and unrest in France and elsewhere in the EU as drivers—and if the euro remains weak for another couple of months, they will recycle those same explanations. We believe the euro is now unjustifiably and illogically low and has failed to stage even a modest correction.
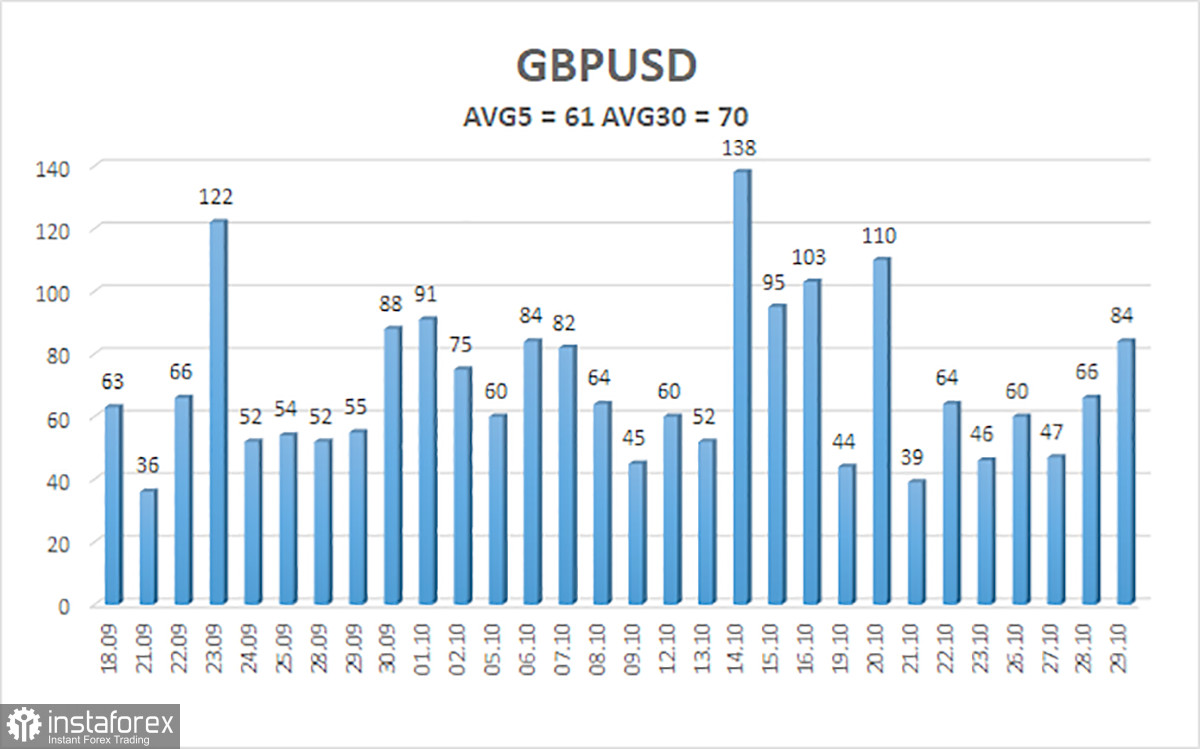
The average volatility of the GBP/USD pair over the last 5 trading days is 61 pips. For the pound/dollar pair, this value is considered "average." Therefore, on Friday, October 30, we expect movement within a range bounded by 1.3306 and 1.3428. The higher linear-regression channel is turning down again. The CCI entered the oversold area twice and formed a bullish divergence, warning of the downtrend's exhaustion.
S1 – 1.3306
S2 – 1.3245
S3 – 1.3187
R1 – 1.3367
R2 – 1.3428
R3 – 1.3489
The GBP/USD pair has begun an uptrend that could develop into a long-term move. Donald Trump's policies will continue to weigh on the U.S. economy, so we do not expect long-term dollar strength. So far in 2026, geopolitics and inflation have supported the dollar, pushing capital into safe havens and prompting the Fed to resume tightening. However, on the weekly timeframe, a flat remains between 1.3150 and 1.3780 within a four-year uptrend, supporting expectations for sterling's medium-term rise. Long positions with targets of 1.3428 and 1.3489 can be considered while price is above the moving average. When price is below the moving average, you can trade the downside with targets of 1.3245 and 1.3184.


