
See also


 03.11.2026 01:41 PM
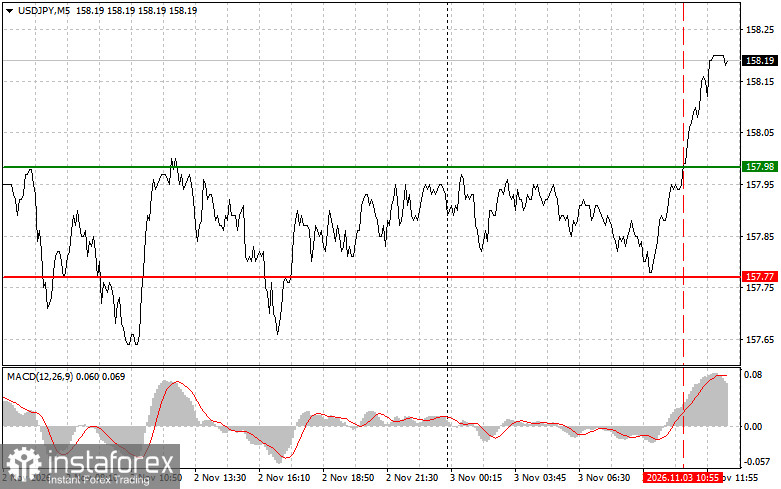
The test of the 157.98 price level during the first half of the day occurred after the MACD indicator had already moved significantly above the zero line, which, in my view, limited the pair's upward potential. For this reason, no dollar buy position was opened.
The US trading session will bring two waves of uncertainty for the yen, both centered on bond yields. The first is related to economic data. In the second half of the day, the Bureau of Labor Statistics will release its Job Openings and Labor Turnover Survey (JOLTS) report, which is expected to show a modest increase in the number of vacancies. The market will also receive factory orders data, with a significant improvement expected, and the Economic Optimism Index, which is forecast to edge lower. If labor market conditions and factory orders prove stronger than expected, traders may become more convinced that the Federal Reserve will maintain its restrictive policy stance. US Treasury yields could then rise, widening the yield differential with Japanese government bonds and supporting USD/JPY. The Economic Optimism Index is likely to receive less attention, as weak readings of this indicator rarely become a decisive factor for the US dollar.
The second wave of uncertainty is linked to the midterm elections. Democrats remain the favorites to win the House of Representatives, while they need to gain a considerable number of seats in the Senate. As a result, Trump's Republican Party risks losing control of both chambers of Congress. While the election outcome remains uncertain, bond yields could fluctuate sharply, with USD/JPY likely to move accordingly.
As for the intraday strategy, the focus will be primarily on the implementation of Scenarios No. 1 and No. 2.
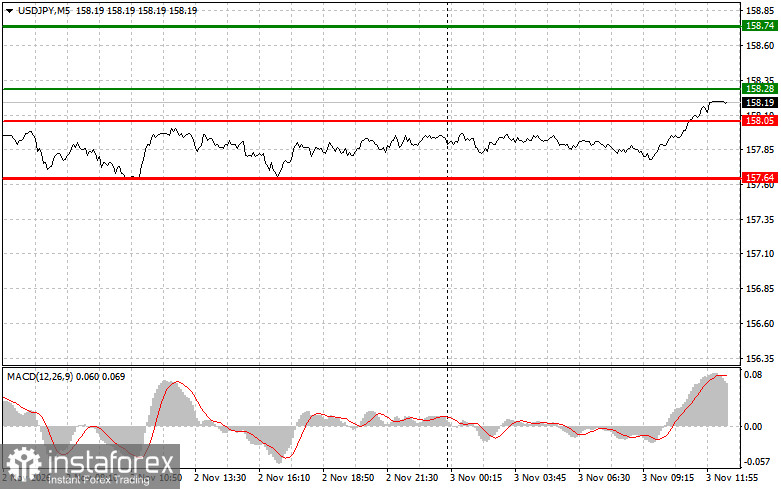
Scenario No. 1: The plan is to buy USD/JPY today if the price reaches the entry level around 158.28 (the green line on the chart), with an upward target of 158.74 (the thicker green line on the chart). Around 158.74, the buy position will be closed and a sell position opened in the opposite direction, targeting a 30–35-point move downward from that level. Further gains in the pair today can only be expected if US economic data are strong. Important: Before buying, make sure that the MACD indicator is above the zero line and has only just begun to rise from it.
Scenario No. 2: USD/JPY can also be bought today if the price tests the 158.05 level twice consecutively while the MACD indicator is in oversold territory. This would limit the pair's downward potential and could trigger an upward market reversal. A rise toward the opposite levels of 158.28 and 158.74 can then be expected.
Scenario No. 1: The plan is to sell USD/JPY today after the price breaks below 158.05 (the red line on the chart), which could trigger a rapid decline in the pair. The sellers' key target will be 157.64, where the sell position will be closed and a buy position opened immediately in the opposite direction, targeting a 20–25-point move upward from that level. Pressure on the pair is likely to return if the central bank intervenes. Important: Before selling, make sure that the MACD indicator is below the zero line and has only just begun to decline from it.
Scenario No. 2: USD/JPY can also be sold today if the price tests the 158.28 level twice consecutively while the MACD indicator is in overbought territory. This would limit the pair's upward potential and could trigger a downward market reversal. A decline toward the opposite levels of 158.05 and 157.64 can then be expected.
Important: Beginner Forex traders should make entry decisions with great caution. It is generally best to stay out of the market ahead of major fundamental data releases to avoid exposure to sharp exchange rate fluctuations. If trading during news releases, always use stop-loss orders to limit potential losses. Without stop-loss orders, the entire trading account can be depleted very quickly, particularly if risk management rules are not followed and large position sizes are used.
It is also important to remember that successful trading requires a clear trading plan, such as the one outlined above. Making spontaneous trading decisions based on current market conditions is fundamentally a losing strategy for an intraday trader.


