
See also


 17.11.2026 06:11 AM
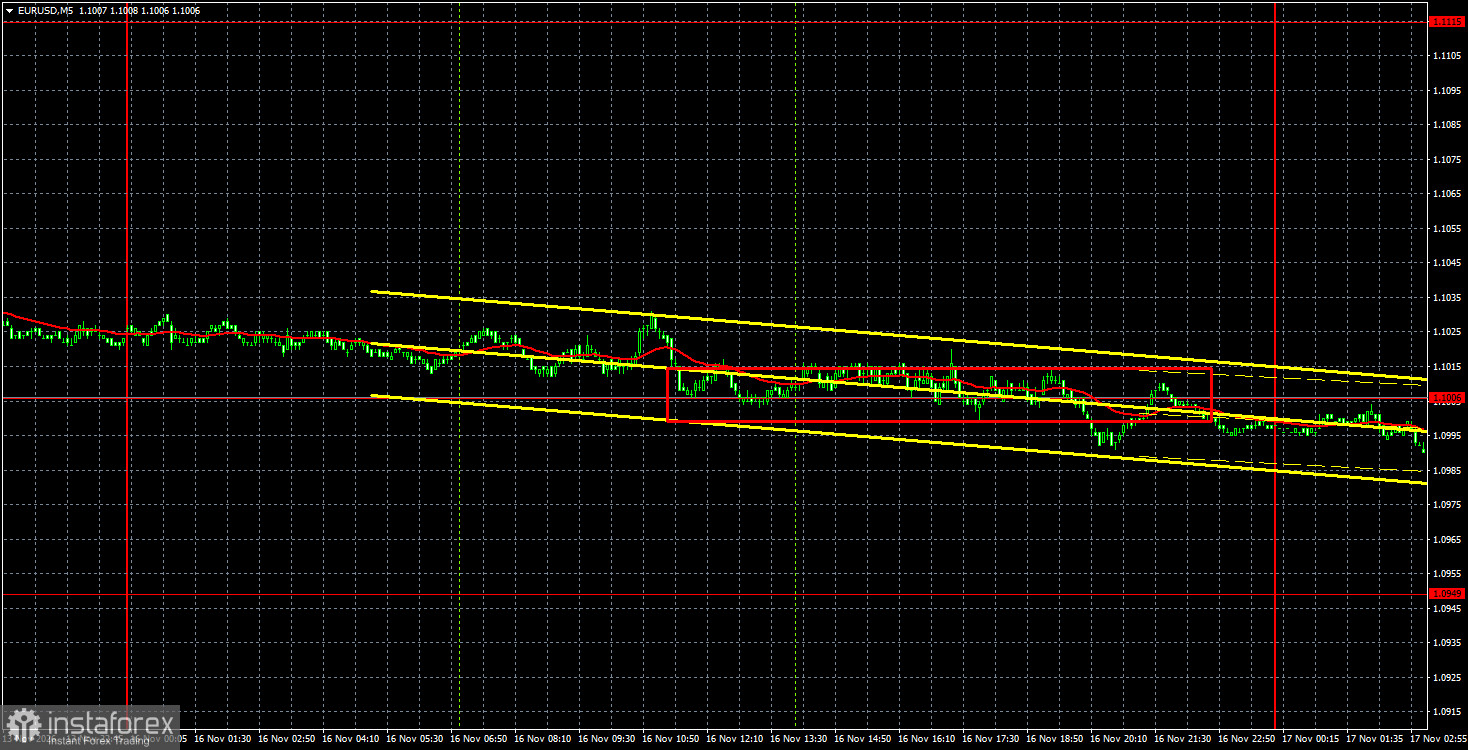
The EUR/USD currency pair continued its downward movement on Monday amid extremely low volatility. It is important to understand this point correctly. The euro continues to fall even on days when the market prefers to pause rather than force events, and fundamentals and macroeconomics are practically absent. What can be noted on Monday? Kevin Warsh's speech? The Federal Reserve chair did not touch on monetary policy and certainly did not announce future changes to the policy rate. The eurozone industrial production report? It was weaker than forecasts, which is not surprising. Also unsurprising is that the market continues to see only negative data for the euro. Therefore, the pair's next decline did not surprise us. Even if EU industrial production had shown a strong result, the euro would still have continued to fall, and all experts would have said that "hawkish expectations about Fed policy continue to rise, which is the reason for the dollar's new strength." Thus, the situation in the FX market does not change, and traders are waiting for new reasons to sell EUR/USD. There may be several such reasons today.
Technically, the EUR/USD pair left the 1.1115–1.1261 sideways channel. Now the euro's decline may continue, and whether there are reasons for a new fall does not matter.
On the 5-minute TF, one trading signal was formed on Monday with difficulty. For 10 hours, the price tried to overcome the 1.1006 level, which it eventually did. Thus, the euro's decline may continue today, targeting 1.0949.
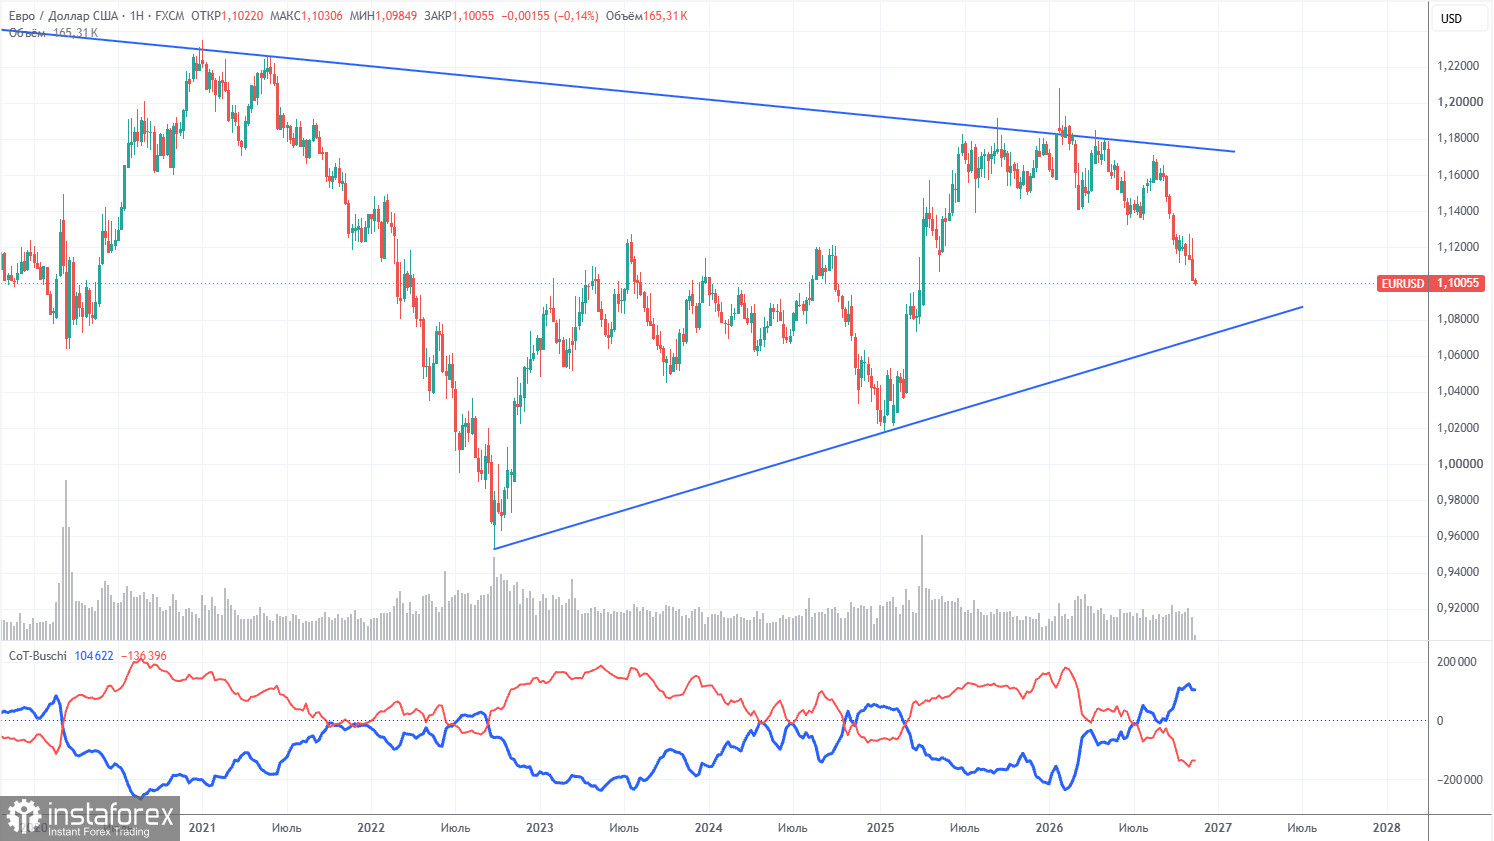
The latest COT report is dated November 10. On the weekly TF chart, it is clear that non-commercial traders' net position remains "bearish" and has substantially decreased in 2026 due to geopolitical events and Fed tightening. Traders have been disposing of the euro in favor of the US dollar over the past nine months. Donald Trump's policy has not changed, which makes it unlikely that the dollar will rely on long-term growth.
We still do not see any fundamental factors that would further strengthen the US currency. The war in the Middle East made the dollar temporarily super- attractive, and the Fed's monetary stance surprised the dollar for the second time this year. In the long term, the euro could fall to $1.08 (trend line), but the upward trend will remain relevant. However, in recent months the market accounts only for positive factors for the dollar and ignores all others.
The positions of the red and blue indicator lines indicate a bears' advantage. Last reporting week, long positions in the "Non-commercial" group decreased by 1,900, while short positions increased by 23,300. Accordingly, the net position for the week rose by 21,400 contracts.
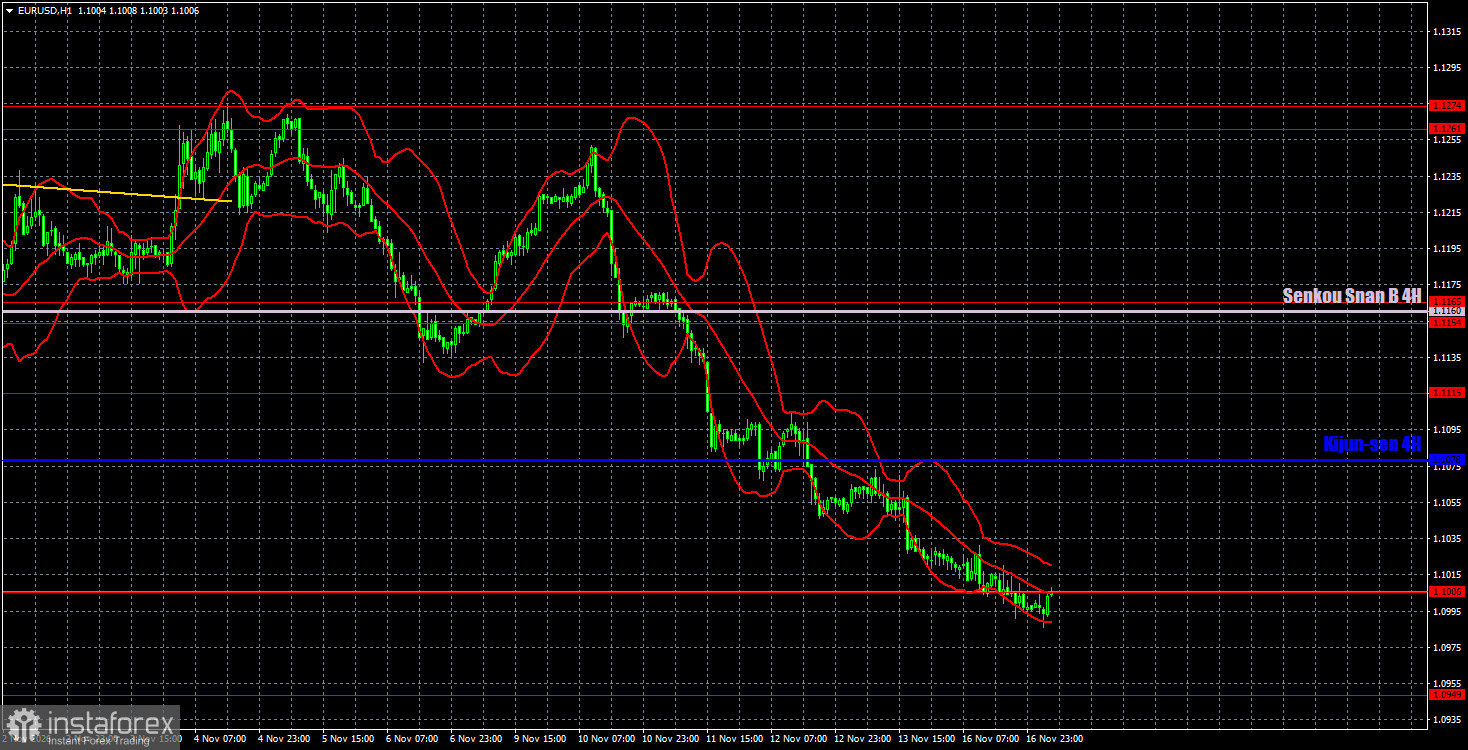
On the hourly timeframe, the EUR/USD pair continues its three-month downtrend without a single significant correction. On the daily and weekly TFs, the chances of a strong, prolonged trend remain high. However, for the euro to rise, it must be bought. Over the past three months, the market has shown no willingness to buy the euro.
For November 17 we highlight the following levels for trading — 1.0886, 1.0949, 1.1006, 1.1115, 1.1154–1.1165, 1.1261–1.1274, 1.1362–1.1368, 1.1461–1.1473, 1.1536–1.1542, as well as the Ichimoku Senkou Span B line (1.1160) and Kijun-sen (1.1078). The Ichimoku indicator lines may move during the day, so account for this when determining trading signals. Remember to move your Stop Loss to breakeven if the price has moved 15 pips in the correct direction. This will protect against possible losses if the signal proves false.
On Tuesday, the EU will publish the not-very-important ZEW economic sentiment indices. At the same time, the US will release more significant industrial production and retail sales reports, which could well trigger new US dollar strength. Overall, there is no sign of the downtrend ending, and the market continues to interpret all events in favor of the dollar.
Traders may consider short positions near 1.0949, since price has consolidated below 1.1006. If the price consolidates above 1.1006, targets of 1.1078 and 1.1115 can be considered for long positions.


