
See also


 20.11.2026 10:01 AM
Gold plunged almost 3% to $3,514 an ounce, the lowest level since early September 2025, and Bitcoin — which many habitually call "digital gold" — offered no protection, trading around $61,900, i.e. at lows not seen since mid?July. The precious metal has fallen almost in a straight line from highs near $4,150 on November 10 and lost 15% over the quarter, while Bitcoin fell about 28% over the same period. Since November 5, when gold traded around $4,100 and Bitcoin closed near $80,400, the metal is down roughly 14% and the cryptocurrency roughly 23%. Once again, the market has not confirmed the "digital gold" story.

The reason for both assets is the same: real yields. Neither gold nor Bitcoin pays interest, cash flow, or earnings, so when government bonds promise ever higher returns above inflation, holding these assets becomes more costly. The US two?year real rate has risen above 2.40% — the highest since 2023 — while the ten? and thirty?year real yields sit at their highest levels in more than two decades. This was confirmed by the November 19 TIPS ten?year auction, where the yield was 2.903% versus 2.653% at the previous issue.
Pressure on real yields will come from the Fed itself. Many expect 25bp hikes in January and March in addition to December's move because of stubborn inflation, and the market agrees. CME shows roughly a 90% probability of a 25bp step on December 9 and about 10% for a 50bp move. Christopher Waller on November 18 called for considering an immediate 50bp hike, and Alberto Musalem on November 17 said several rate hikes will be needed through spring 2027 that would lift the real rate by about one percentage point.
The situation is worse for cryptocurrencies than for gold because the metal has buyers who are less rate?sensitive — central banks and Chinese households that buy on dips — while Bitcoin lacks such a cushion. Inflows to US Bitcoin ETFs have turned to outflows, about $1.91bn over seven sessions through November 13; stablecoin supply fell by $14.2bn over the month, according to Glassnode as of November 11; and visible demand per CryptoQuant plunged to minus 255,000 BTC over 30 days versus a monthly average of minus 172,000. Money is leaving the market not only via price declines but also through the inflow channels, which is why every rebound looks weak.
All this suggests pressure on crypto is not yet exhausted. I believe that while real yields and the dollar keep making highs and the Fed prepares a December rate hike, Bitcoin lacks an external driver for a sustainable rise, and any move up to $63,000–$64,000 will be used for selling. A close below $62,000 would open the way to $60,000, where large buy orders and protective options are concentrated, with the next target the June low near $58,500. I do not rule out the bottom forming closer to the Fed meeting on December 9, and only after that would a true reversal begin — which would require either weak inflation data or a softer regulatory tone.
Technical analysis and recommendations
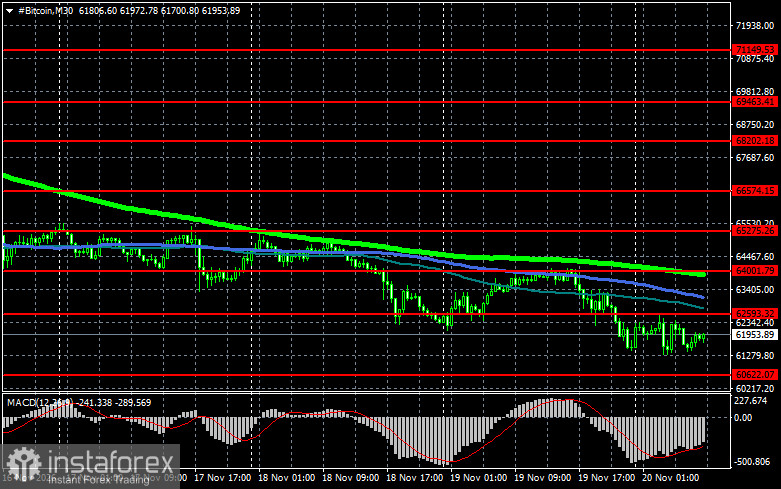
Bitcoin
Buyers are currently targeting a return to $62,600, which would open a direct path to $64,000, and from there $66,500 is within reach — a breach of which would signal attempts to return to a bull market. On the downside, I expect buyers at $60,600. A move back below that area could quickly drop BTC toward $58,500. The farthest target would be around $56,100.
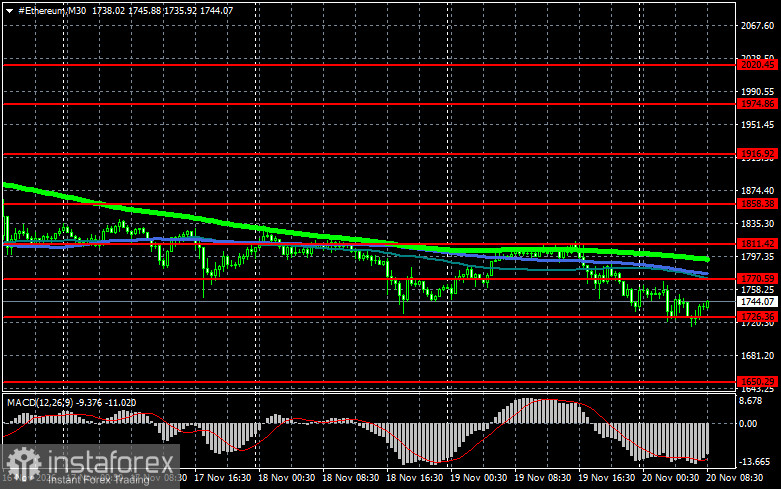
Ethereum
A clear close above $1,770 would open a direct path to $1,811. The further target is the high around $1,858; breaking that would indicate strengthening bullish sentiment and renewed buyer interest. On the downside, I expect buyers at $1,726. Falling back below that area could quickly push ETH toward $1,650. The farthest target would be around $1,573.
Comments on the chart
Price testing or crossing any of these moving averages often either halts movement or injects fresh momentum into the market.


