
यह भी देखें


 30.10.2026 05:55 AM
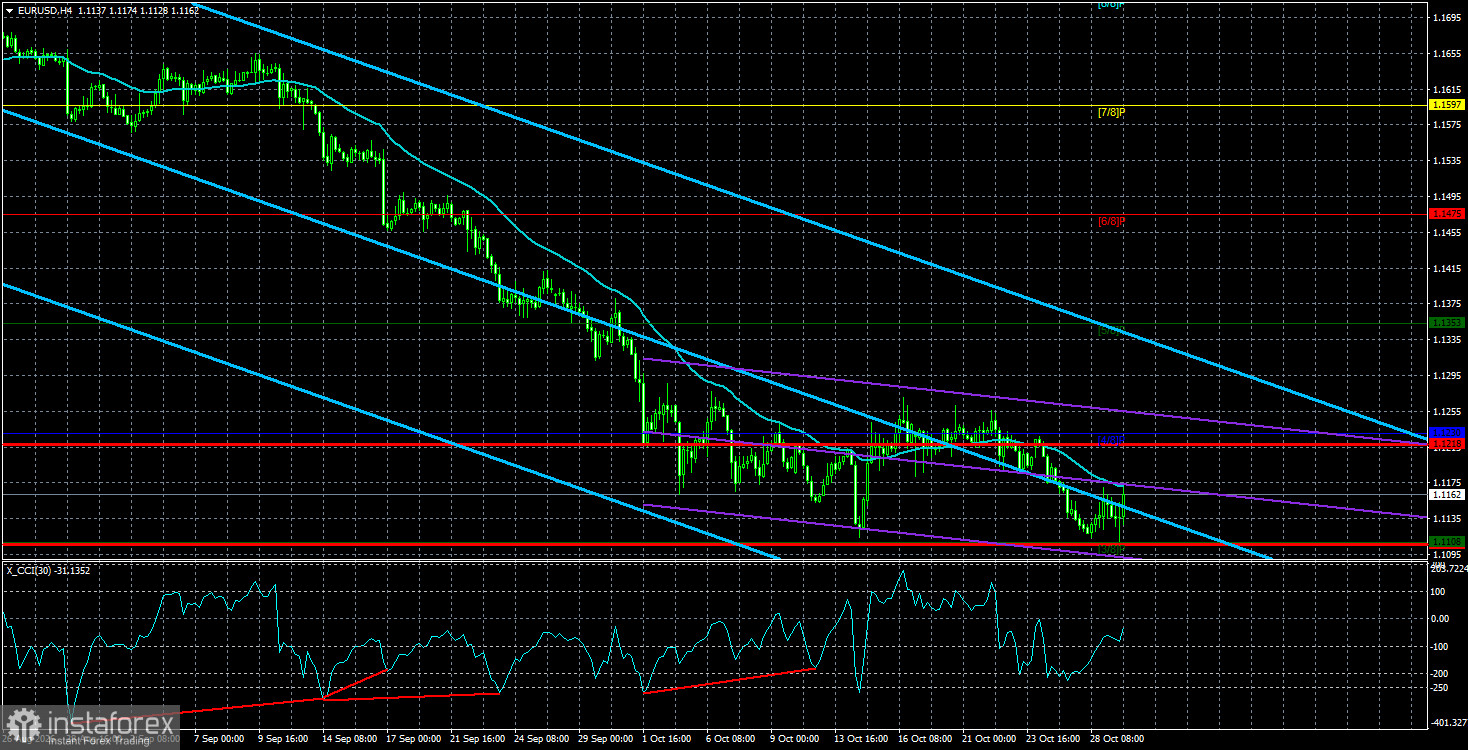
On Wednesday evening, the EUR/USD pair showed virtually no movement and no meaningful reaction to the Federal Reserve meeting at timeframes above the 5-minute chart. There had to be some reaction, of course, but what can one say when Wednesday's overall volatility was only 56 pips? The euro rose minimally — so little that it's hard to see on the 4-hour chart without a magnifier. In essence, nothing changed for the euro on Wednesday. It remains at the lows for no clear or convincing reason. Correlation with the pound is currently non-existent, so it should not surprise anyone that sterling broadly resists the dollar while the euro does not. The pound occasionally posts gains and remains inside its daily sideways channel. The euro, by contrast, has been falling for two months and sits in a corrective — yet persistent — downtrend on the daily chart.
To our mind, this situation says only one thing: the market is systematically working off every factor in favor of the dollar. But when those factors end, the market will price in, in hindsight, the very factors that have supported the euro. We accept that riots in France or Italy are reasons to sell the euro — but not for two months straight. We accept that Fed policy matters more than European Central Bank policy, but the Fed has tightened only once while the dollar has been rising for two months. In our view, the euro is at the mercy of speculators—or even the ECB itself, which in theory could carry out FX intervention to weaken its own currency. In any case, the euro's move over the past two months has nothing to do with logic, fundamentals or macroeconomics.
Geopolitics is also unlikely to explain the euro's decline. If geopolitical tension were rising, why is the pound not falling as well? Remember, the Bank of England is likely to raise rates for the first time next week. If both the euro and the pound are "risk" currencies, it would be far more logical to see the pound fall abnormally, not the euro collapse.
Yesterday the ECB met in the euro area. The bank predictably left all three interest rates unchanged, which again provoked almost no emotion from traders. It feels like the market no longer cares about fundamentals or macro releases—which reinforces our view that the euro's weakness lies not in news or reports but in market dynamics.
Even important U.S. reports didn't move the euro. U.S. Q3 GDP rose 3.4%, beating forecasts, and core PCE inflation accelerated to 3.1%, in line with expectations. In both cases, the dollar had every reason to strengthen. But the dollar has been rising for two months with hardly any pauses or pullbacks, so when the next leg up starts matters less than the fact that the market passionately wants to keep selling EUR/USD — and it will always find reasons to do so. For now, we see no sign that traders are in any hurry to lock in profits on dollar longs.
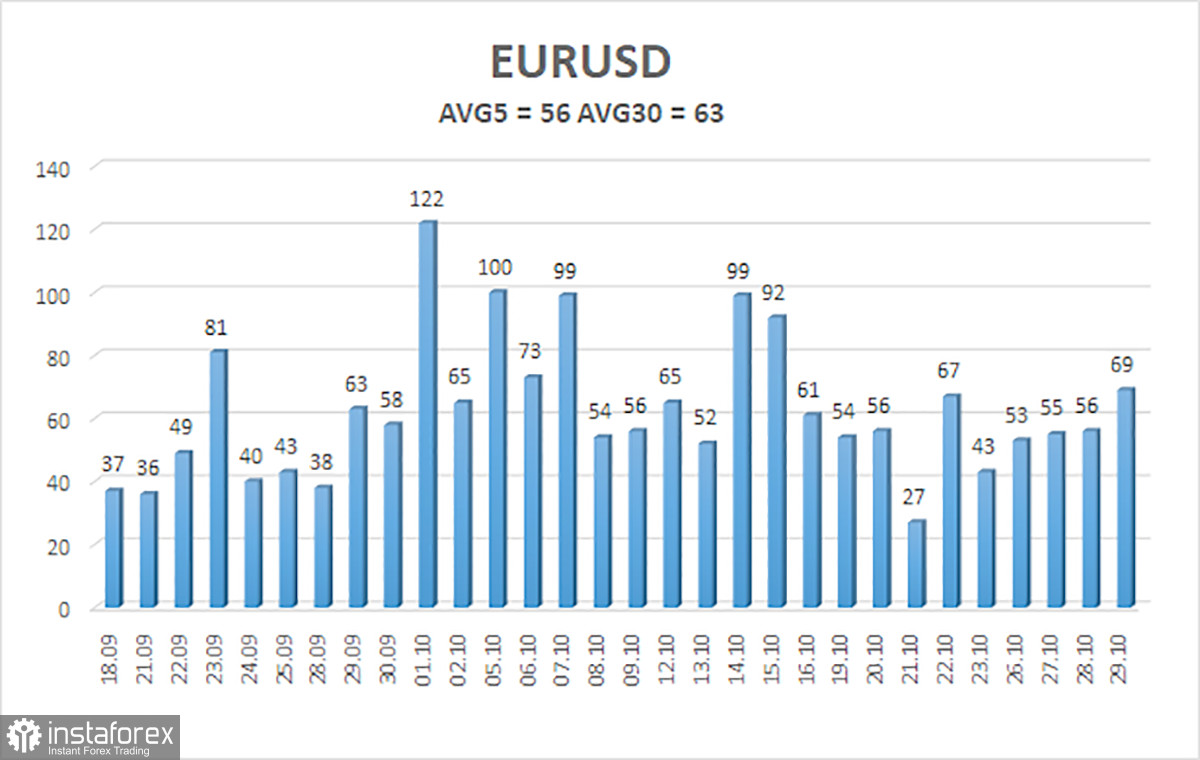
The average volatility of EUR/USD over the last 5 trading days, as of October 30, is 56 pips, which we classify as "average." We expect the pair to move between 1.1106 and 1.1218 on Friday. The higher linear-regression channel has turned down, indicating another trend change. The CCI entered the oversold area five times and formed four bullish divergences, warning that the illogical downtrend may be ending. However, the market has reacted weakly to these technical signals so far.
S1 – 1.1108
S2 – 1.0986
S3 – 1.0864
R1 – 1.1230
R2 – 1.1353
R3 – 1.1475
The EUR/USD pair continues to move downward, but we still view the decline as a correction before a new uptrend. The global fundamental backdrop for the dollar remains unfavorable, but in 2026, geopolitics first and then the Fed's hawkish stance provided strong support for the U.S. currency. When price is below the moving average, consider shorts with targets at 1.1108 and 1.0986. Above the moving average, long positions are relevant, with targets at 1.1230 and 1.1353.

