empty
28.12.2022 01:53 PM
U.S. Stock Market Analysis on 27th December and 23rd December Post Market Review

U.S. markets are closed on Monday in observance of Christmas Day, which falls on Sunday. U.S. indices were up on Friday, while the inflation data released on Friday is being accessed as the market diverges in outlook vs the Fed. The Dow Jones was up 0.53% to 33,203.93, the S&P500 rose 0.59% to 3,844.82, and the NASDAQ was up 0.21% to 10,497.86. At the same time, oil prices jumped.

Notable News

  • China to scrap Covid quarantine rule for inbound travelers from Jan 8
  • US Core PCE Price Index +0.2% M/M, matching estimates; Consumer spending stagnated at +0.1% M/M - weakest since Jul-22 and below 0.2% forecast
  • Uni of Michigan Consumer Sentiment Index rose to 59.7, up from Oct's 56.8, helped by easing inflation pressures
  • US new home sales unexpected rose for second month
  • BOJ's Kuroda dismisses near-term chance of exiting easy policy

What To Watch This Week

  • Japan - Unemployment, Retail Sales (Tuesday), Industrial Production (Wednesday)
  • China - Industrial Profits (Tuesday), Manufacturing PMI (Saturday)
  • US - Goods Trade Balance, Retail Inventories (27th), Pending Home Sales (Wednesday), Initial Jobless Claims (Thursday)
  • UK - Nationwide Housing Pries (Friday)
  • At home, PPI (Thursday), Money Supply (Friday) are due

Long-term view on market and 2023 outlook:

In general, investors are still concerned about the market outlook and the fears are increasing. The economic recession seems inevitable, as major monetary authorities are determined to continue to battle high inflation. In my view, monetary policy will turn accommodative as inflation trends down. Growth pressures still weigh on developed markets' equity in 1Q 2023, but a turn in monetary policy will provide liquidity support to asset prices. Consensus expects interest rates to peak around 5.0% in the middle of 2023, which indicates it is closer to the end of the hiking cycle. I remain cautious on U.S. equities into 1Q 2023, and I believe the market will be more positive as markets bottom out in 2Q 2023.

27th December trading analysis

S&P 500 daily chart:

This image is no longer relevant

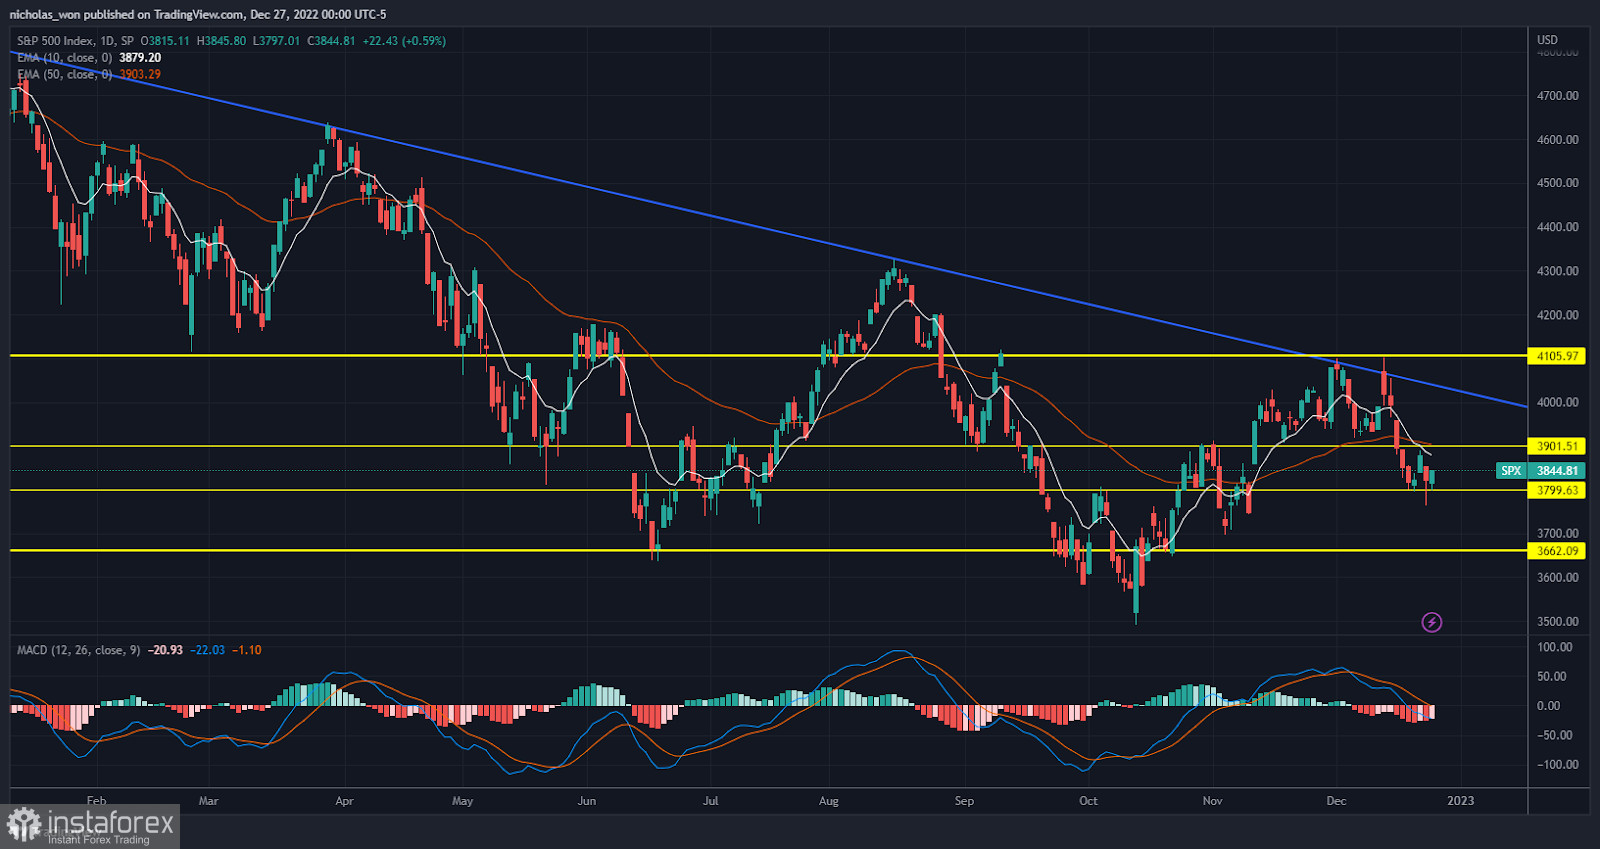
The S&P 500 index finished higher in a turbulent pre-holiday session Friday, as an inflation report and a slew of other data did nothing to change views that the Federal Reserve would likely keep raising interest rates even if the economy slowed. From the daily chart, the price is hovering between $3,784 support level and $3,947 resistance level. It is crucial to continue to watch the price movement in these few days to see whether the bull traders will successfully break through the $3,947 resistance level and push it to the next support level at around $4,072, or the bear traders will pull the price to the $3,784 support line and continue fall to the $3,662 support line. Traders may find an opportunity to trade between $3,784 and $3,947 as the index already traded in this range for a few days. Nonetheless, given the Fed would likely continue to raise the interest rate and the index is still trading below its 10MA and 50MA lines, I suggest traders remain cautious.

InstaTrade Analyst,
Analytical expert of InstaTrade
© 2007-2025

Recommended Stories

GBP/USD – 16 de junho: Os touros mantêm o nível de 1,3527

No gráfico horário, o par GBP/USD na sexta-feira se recuperou duas vezes do nível de retração de Fibonacci de 127,2% em 1,3527 e subiu em direção à zona de resistência

Samir Klishi 16:52 2025-06-16 UTC+2

Análise técnica do movimento diário dos preços do par USD/IDR, segunda-feira, 16 de junho de 2025.

Com o surgimento do padrão Bullish 123, em meio às condições de enfraquecimento deste par de moedas exóticas, e com a confirmação pelo movimento do preço do USD/IDR dentro

Arief Makmur 15:57 2025-06-16 UTC+2

Análise técnica do movimento intradiário dos preços do petróleo bruto, segunda-feira, 16 de junho de 2025

No gráfico de 4 horas do Petróleo Bruto (#CL), podemos observar a formação de uma divergência entre o movimento dos preços do #CL e o indicador Estocástico. Isso indica

Arief Makmur 15:41 2025-06-16 UTC+2

XAU/USD. Análise e previsão

O ouro mantém, no momento, suas perdas intradiárias, pressionado pelo sentimento amplamente positivo nos mercados acionários, que enfraquece a demanda pelo metal precioso. No entanto, uma combinação de fatores impede

Irina Yanina 14:09 2025-06-16 UTC+2

Sinais de negociação para o EUR/USD para 13-19 de junho de 2025: compre acima de 1,1500 (SMA 21 - 7/8 de Murray)

Por outro lado, se o euro cair abaixo de 1,1490, é provável que recue até a EMA 200, situada em 1,1340, região que também coincide com a base do canal

Dimitrios Zappas 15:20 2025-06-13 UTC+2

Sinais de negociação para o OURO para 13-19 de junho de 2025: vender abaixo de 3.343 ( SMA 21 - 8/8 de Murray)

O ouro deixou um gap em 3.282 e outra em torno de 3.181. Portanto, se o preço cair abaixo do nível psicológico de 3.300, poderíamos esperar que ele caísse para

Dimitrios Zappas 15:16 2025-06-13 UTC+2

Previsão para o EUR/USD em 13 de junho de 2025

Na quinta-feira, o par EUR/USD continuou seu movimento ascendente e se consolidou acima do nível de retração de Fibonacci de 100,0% em 1,1574. No entanto, durante a noite, houve

Samir Klishi 14:40 2025-06-13 UTC+2

Previsão para o GBP/USD em 13 de junho de 2025

No gráfico horário, o par GBP/USD na quinta-feira se recuperou do nível 1,3520, subiu para a zona de resistência de 1,3611–1,3620, ricocheteou duas vezes e depois caiu de volta para

Samir Klishi 14:24 2025-06-13 UTC+2

EUR/USD. 12 de junho. Um revés para o dólar

Bom dia, caros traders! Na quarta-feira, o par EUR/USD continuou seu movimento de alta após se recuperar da zona de suporte de 1,1374–1,1380. Ele se consolidou com sucesso acima

Samir Klishi 16:33 2025-06-12 UTC+2
Não pode falar agora?
Faça sua pergunta no chat.
 

Dear visitor,

Your IP address shows that you are currently located in the USA. If you are a resident of the United States, you are prohibited from using the services of InstaFintech Group including online trading, online transfers, deposit/withdrawal of funds, etc.

If you think you are seeing this message by mistake and your location is not the US, kindly proceed to the website. Otherwise, you must leave the website in order to comply with government restrictions.

Why does your IP address show your location as the USA?

  • - you are using a VPN provided by a hosting company based in the United States;
  • - your IP does not have proper WHOIS records;
  • - an error occurred in the WHOIS geolocation database.

Please confirm whether you are a US resident or not by clicking the relevant button below. If you choose the wrong option, being a US resident, you will not be able to open an account with InstaTrade anyway.

We are sorry for any inconvenience caused by this message.