Veja também

 18.09.2025 11:38 AM
Trend analysis (Fig. 1).
On Thursday, from the 1.1812 level (yesterday's daily candle close), the market may continue moving downward toward the target of 1.1762 – the 85.4% pullback level (red dotted line). Upon testing this level, the price may rebound upward toward 1.1779 – the upper fractal (red dotted line).
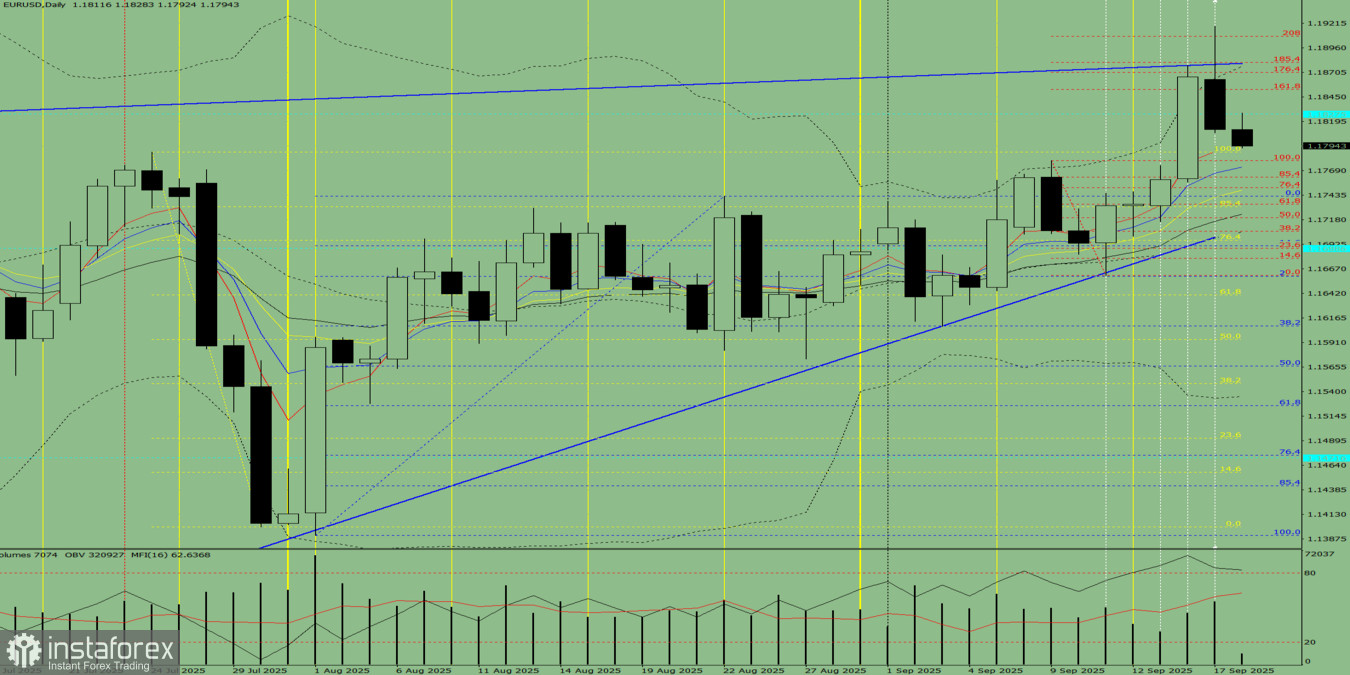
Fig. 1 (daily chart).
Comprehensive analysis:
General conclusion: bearish trend.
Alternative scenario: on Thursday, from the 1.1812 level (yesterday's daily candle close), the market may continue moving downward toward 1.1779 – the upper fractal (red dotted line). Upon testing this level, the price may rebound upward toward 1.1828 – the historical resistance level (blue dotted line).
You have already liked this post today
*A análise de mercado aqui postada destina-se a aumentar o seu conhecimento, mas não dar instruções para fazer uma negociação.


