Veja também

 23.12.2025 07:36 AM
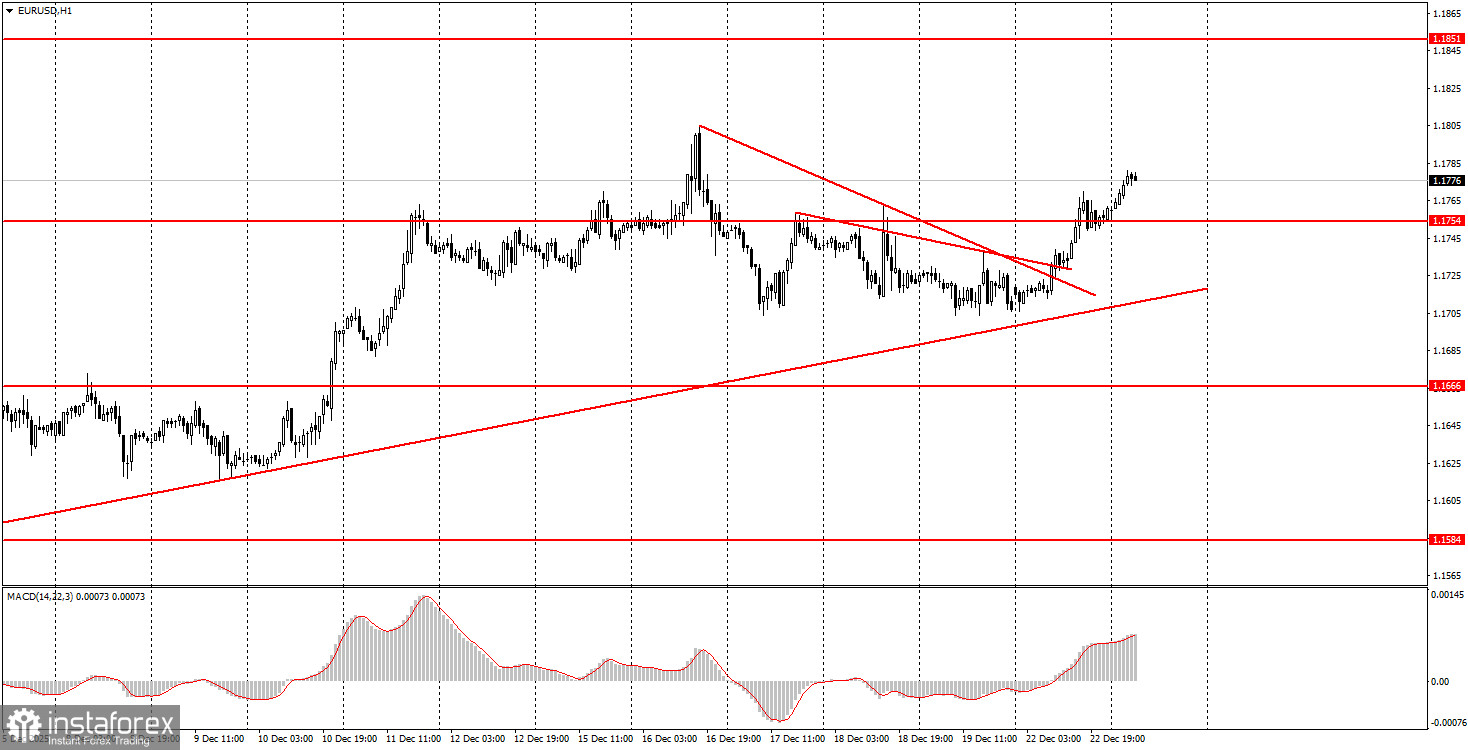
The EUR/USD currency pair unexpectedly began to rise on Monday. This was surprising on both fundamental and macroeconomic grounds, especially given that it is the start of the Christmas week. On Monday, there were no important events or reports scheduled in the Eurozone or the US; nevertheless, the European currency appreciated by 70 pips. For us, any increase in the EUR/USD pair is logically expected. Moreover, we warned that in the context of a "thin" market, volatile trend movements are even more likely than in recent weeks and months, making it easier to move the price. From a technical standpoint, the pair settled above two descending trend lines in the morning while maintaining the relevance of a long-term ascending trend line. Therefore, novice traders could have opened long positions at the very start of the movement. The pair is once again approaching the upper line of the sideways channel 1.1400-1.1830 on the daily timeframe and has every chance of breaking through this time. We consider it possible that the end of the six-month flat phase may coincide with Christmas and the New Year.
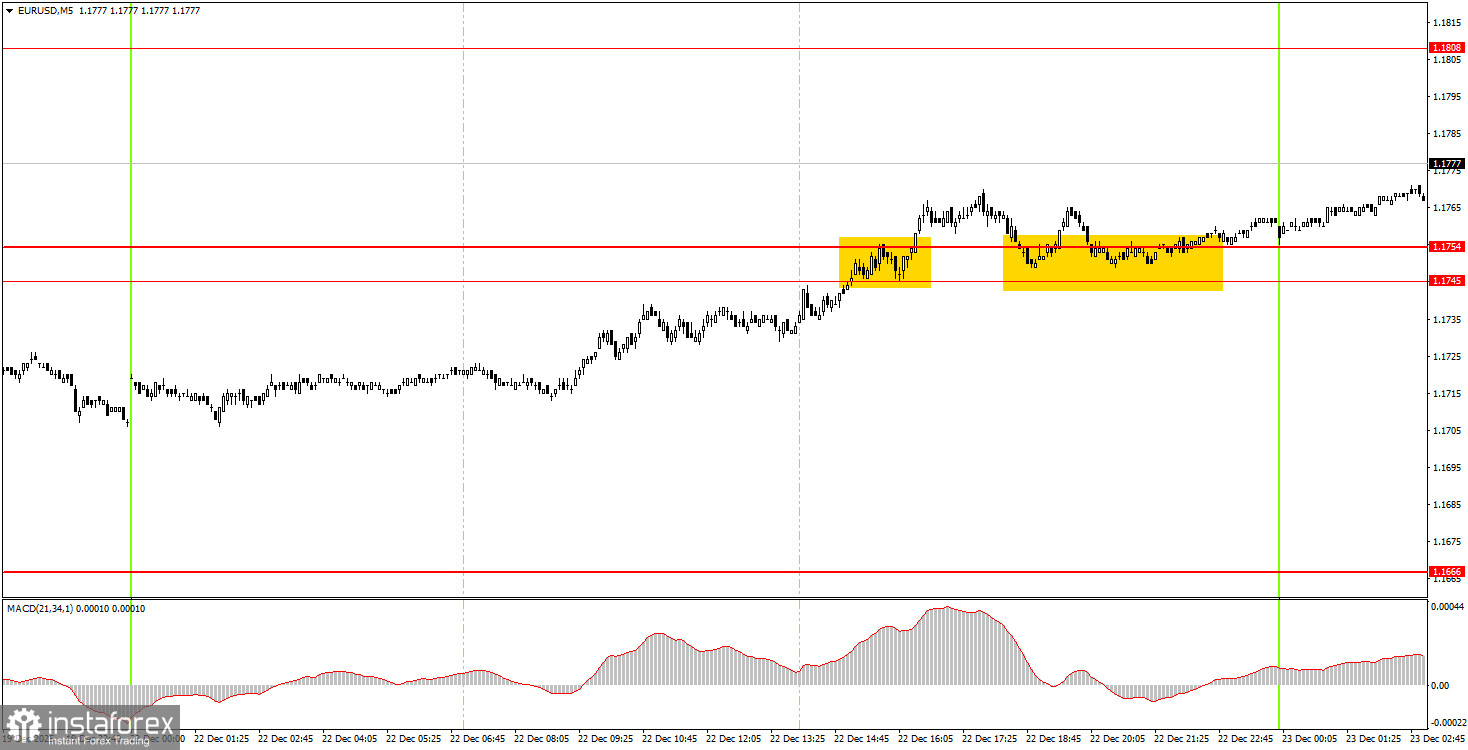
On the 5-minute timeframe, two buy signals were generated on Monday. First, the pair broke above the area of 1.1745-1.1754 and then bounced off it from above. Thus, novice traders could open another long position if they missed the first opportunity, based on the signal from the hourly timeframe.
On the hourly timeframe, the EUR/USD pair continues to form an upward trend. The price may soon test the 1.1800-1.1830 area, which marks the upper boundary of the flat on the daily timeframe. This time, we may witness a breakout. The overall fundamental and macroeconomic background remains very weak for the US dollar; therefore, we expect the pair to rise in the medium term.
On Tuesday, novice traders can trade in the area of 1.1745-1.1754. Two buy signals have already been formed on Monday. In a "thin" market, the growth may continue on Tuesday. However, today there will also be macroeconomic events, so a market reaction should be expected—any kind of reaction.
On the 5-minute timeframe, levels to consider include 1.1354-1.1363, 1.1413, 1.1455-1.1474, 1.1527-1.1531, 1.1550, 1.1584-1.1591, 1.1655-1.1666, 1.1745-1.1754, 1.1808, 1.1851, 1.1908, and 1.1970-1.1988. On Tuesday, there are no important events or reports scheduled in the Eurozone, while the US will release reports on GDP, industrial production, and durable goods orders. These are quite important reports, so a market reaction to them should be anticipated.
Important Note: Significant speeches and reports (always included in the news calendar) can greatly influence the movement of the currency pair. Therefore, during their release, it is advisable to trade cautiously or exit the market to avoid sharp reversals against the preceding movement.
Remember: For beginners trading in the Forex market, it is important to understand that not every trade can be profitable. Developing a clear strategy and practicing money management are keys to long-term trading success.


