Veja também

 16.01.2026 03:28 AM
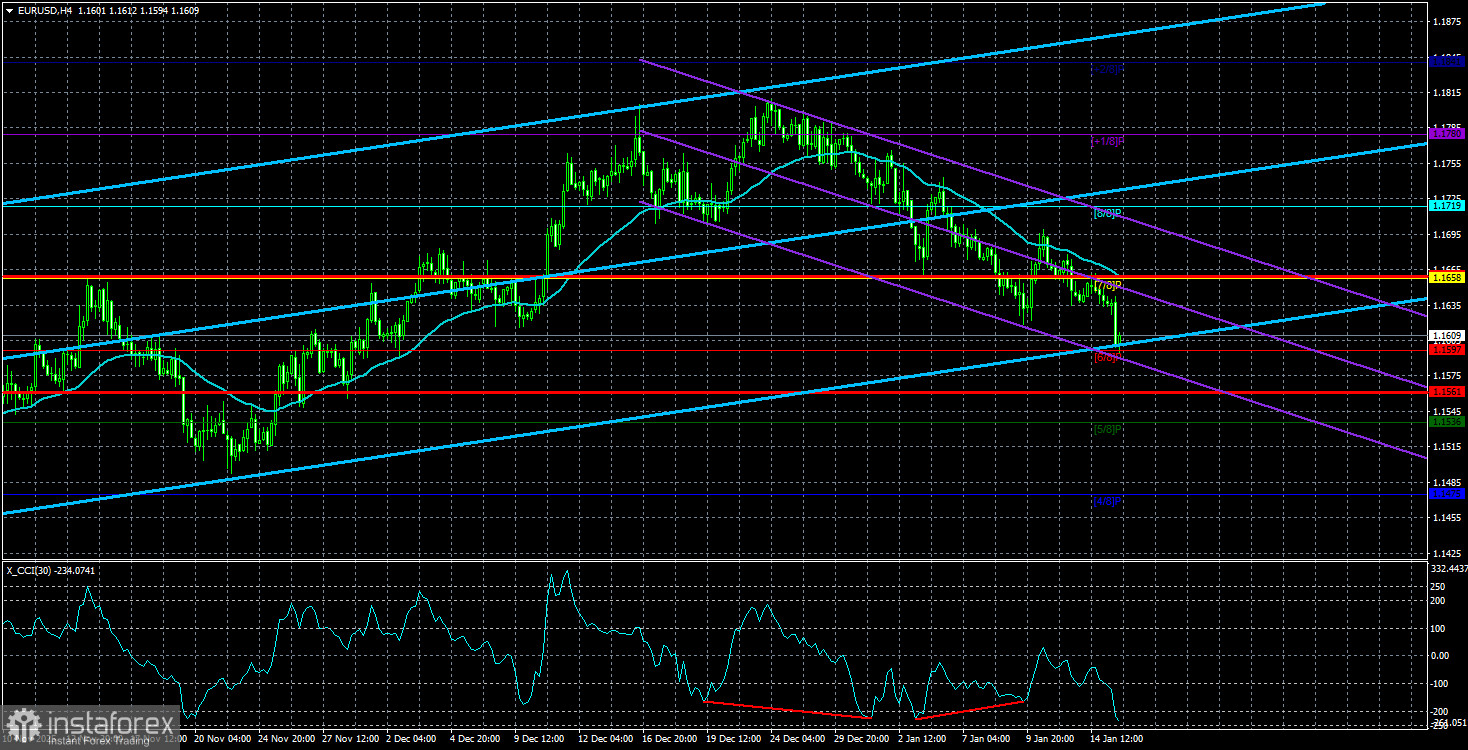
The EUR/USD currency pair traded with minimal volatility on Thursday. In general, even in 2026, traders may have already become accustomed to this state of affairs. The euro continues to slip down slowly, very slowly, and the market pays no attention to fundamentals or macroeconomics. Most traders and even analysts regularly make the same mistake. They try to explain every move, every report, and every piece of news. But they forget that the market is not obliged to react to every report or news item, and that movements are not always "because of" something; they can be purely technical.
We regularly say that a move is illogical if it contradicts fundamentals and macroeconomics. And that is also an absolutely normal situation for the FX market, because, once again, the market is ruled by market makers, and market makers are people. They are not obliged to process every report or every event. As a rule, these are large banks that can form long-term positions for months, causing minimal price fluctuations and illogical market moves. Therefore, we try to highlight the key factors for a certain period of time — the factors that work now, not those by which one can post-factum explain why we saw or did not see a particular move.
For example, on Wednesday, January 14, the daily volatility was 25 pips, despite several US reports scheduled for that day and the fact that geopolitical news is delivered to traders practically every day. What is 25 pips? It is an absolute anti-record for recent years. Essentially, that figure means there were practically no moves in the market that day. Nevertheless, many experts continue to look for a black cat in a dark room that is not there. If the market is not reacting now to geopolitics, the criminal prosecution of Jerome Powell, or macroeconomic data (recall that we are talking about reports not only this week but last week as well), then the conclusion is only one — at the moment, the market does not react to news.
The key factor for the current downward movement of the pair is only the flat on the daily TF. The flat has continued for seven months in a row. Now think: really, in the last seven months were there no important reports, events, central bank meetings, unexpected regulator decisions, geopolitical events that could have moved the pair off the spot for so long? Or is every successive event opposite in character to the previous one (seven months in a row!!!), so the price remains in one range?
Thus, the current fall of the euro is not an increase in risk-off sentiment in the market, not a rise in demand for the "safe" dollar due to geopolitical tension, not a reaction to US macro data (especially since most reports failed). It is purely a technical move, minimal in strength, that began after the upper boundary of the daily sideways channel 1.1400–1.1830 was worked off.
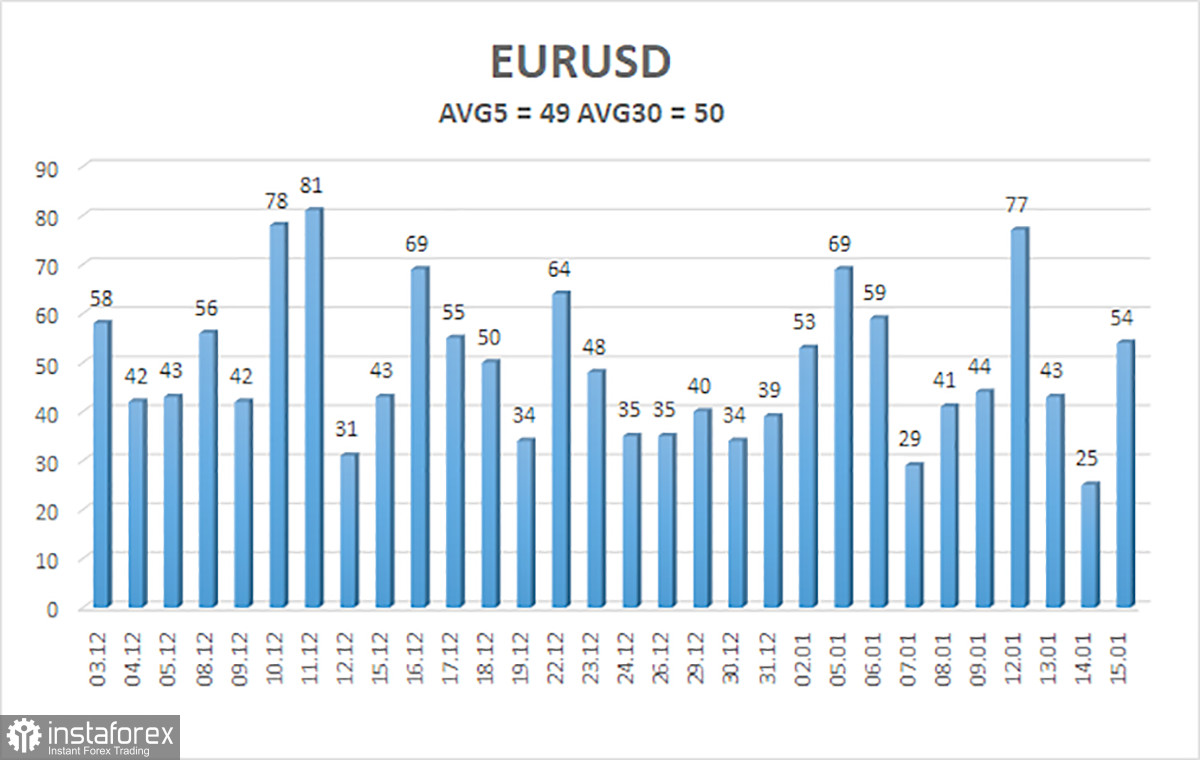
The average volatility of the EUR/USD pair over the last 5 trading days as of January 16 is 49 pips, which is characterized as "low." We expect the pair to move between 1.1561 and 1.1659 on Friday. The higher linear regression channel points upward, but in fact, the daily TF flatline still persists. The CCI indicator recently formed another "bullish" divergence, which again points to a resumption of the uptrend. However, the key point remains the daily TF flat.
S1 – 1.1597
S2 – 1.1536
S3 – 1.1475
R1 – 1.1658
R2 – 1.1719
R3 – 1.1780
The EUR/USD pair remains below the moving average, but on all higher TFs the uptrend is preserved, and on the daily TF the flat has persisted for 7 months in a row. The global fundamental background still matters greatly to the market, and it remains negative for the dollar. Over the past six months, the dollar has occasionally shown weak gains, but exclusively within the sideways channel. It lacks a fundamental basis for long-term strengthening. With the price below the moving average, small shorts can be considered with targets 1.1561 and 1.1536 on purely technical grounds. Above the moving average line, long positions remain relevant, with a target of 1.1830 (the upper line of the daily TF flat), which has already been effectively worked and not overcome.


