Veja também

 26.02.2026 09:46 AM
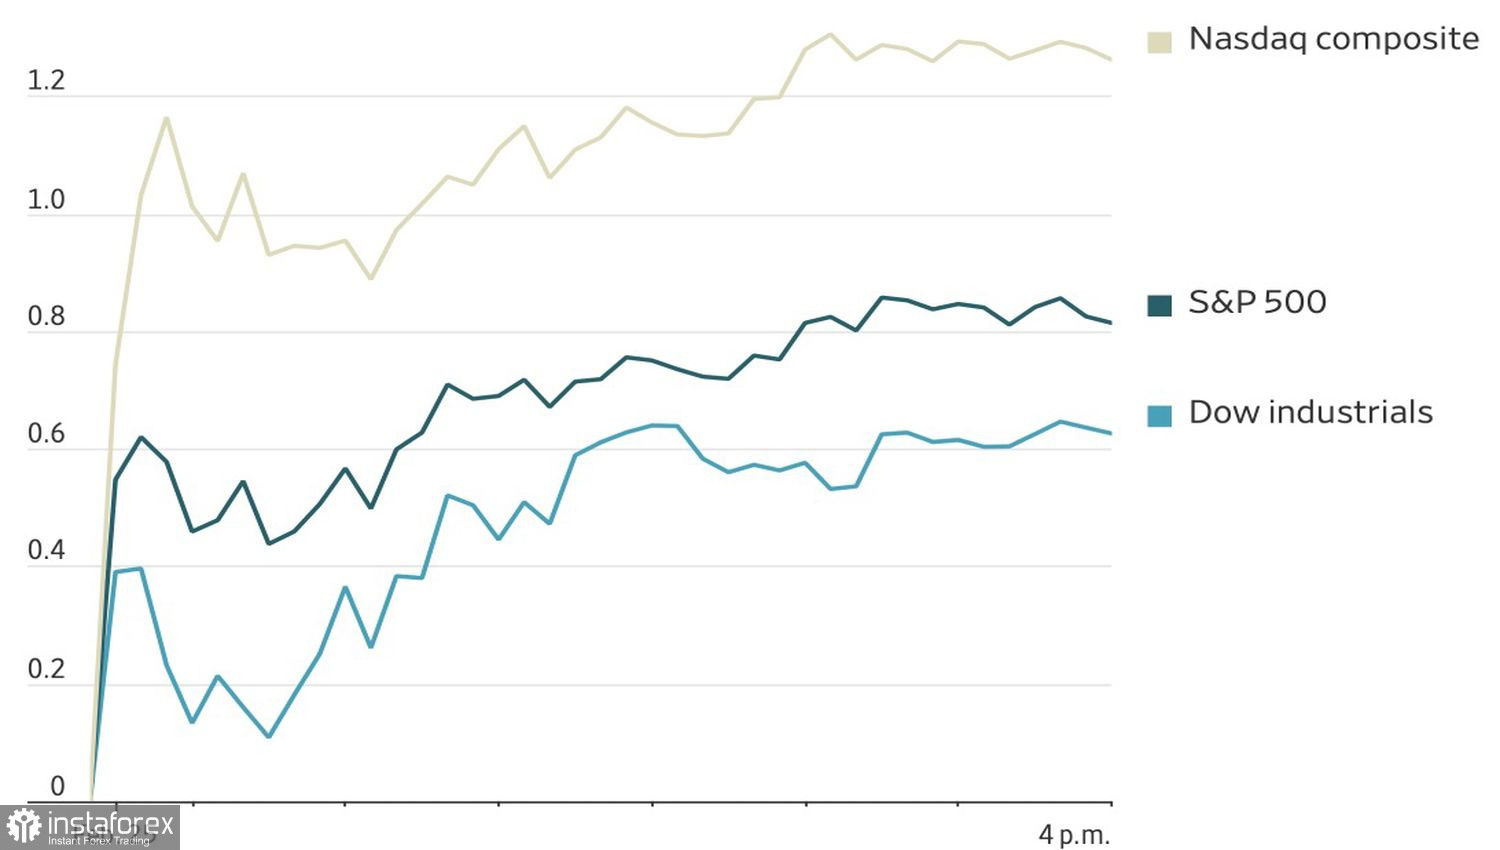
When you get used to abundance, you become selective. From 2023 to 2025, investors were buying anything related to artificial intelligence. However, by 2026, they are focusing on identifying winners and losers, though these roles frequently change. As a result, the S&P 500 is experiencing roller-coaster movements. Its two-day rebound is essentially a shift, turning yesterday's underperformers into the new leaders. NVIDIA's strong earnings outlook also contributed to the rally.
Performance of US stock indices
Among the winners were IBM, Oracle, and the State Street fund, which focuses on software companies. These same stocks had been actively sold off following concerns about the negative impact of AI.
Despite the pullback, S&P 500 bears remain hopeful for a reversal, holding at least three key cards. First, the relatively low returns from AI compared to the massive investments tech companies have made. Second, the excessive euphoria from investors who were buying indiscriminately, which is expected to fade sooner or later. Finally, the potential economic and business risks posed by AI.
NVIDIA's earnings report played a role in sending the S&P 500 bears back into hiding. Fourth-quarter sales reached $68.1 billion, with data center revenue surging by 75%, and net income rising by 94% compared to the first quarter. Given that the tech giant makes up 8% of the broad index, it is no surprise that positive expectations boosted the entire equity market. However, only five out of the 11 sectors closed in the green.
NVIDIA's stock reaction to earnings
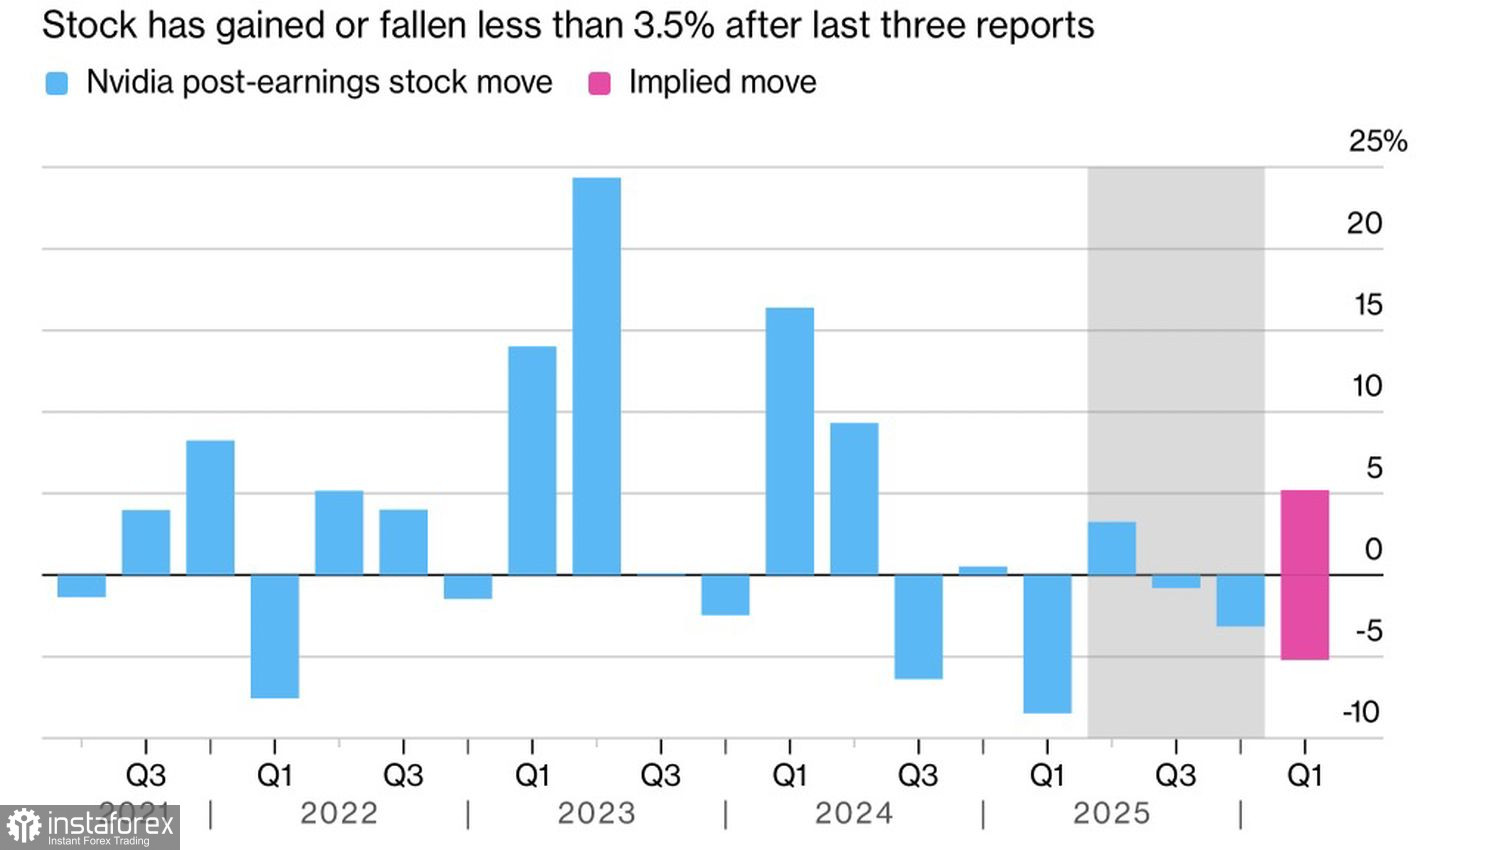
Most of the good news from NVIDIA is already priced into the S&P 500. Since the earnings report was released after the market closed on February 25, the index risks opening with another gap up, which could then be filled due to the "buy the rumor, sell the fact" principle.
It is important to note that the renewed interest in tech stocks is coming at the expense of small-cap stocks, which had been thriving at the end of last year. The Russell 2000 index is particularly sensitive to the health of the US economy, so the slowdown in GDP to 1.4% in the fourth quarter and the delcine in the likelihood of a Fed rate cut in June to 46% are weighing on the index.
Internal US sector rotation may reverse, as could the capital flows that were previously moving from the United States to Europe. According to Bloomberg experts, European stock indices have likely hit their ceiling.
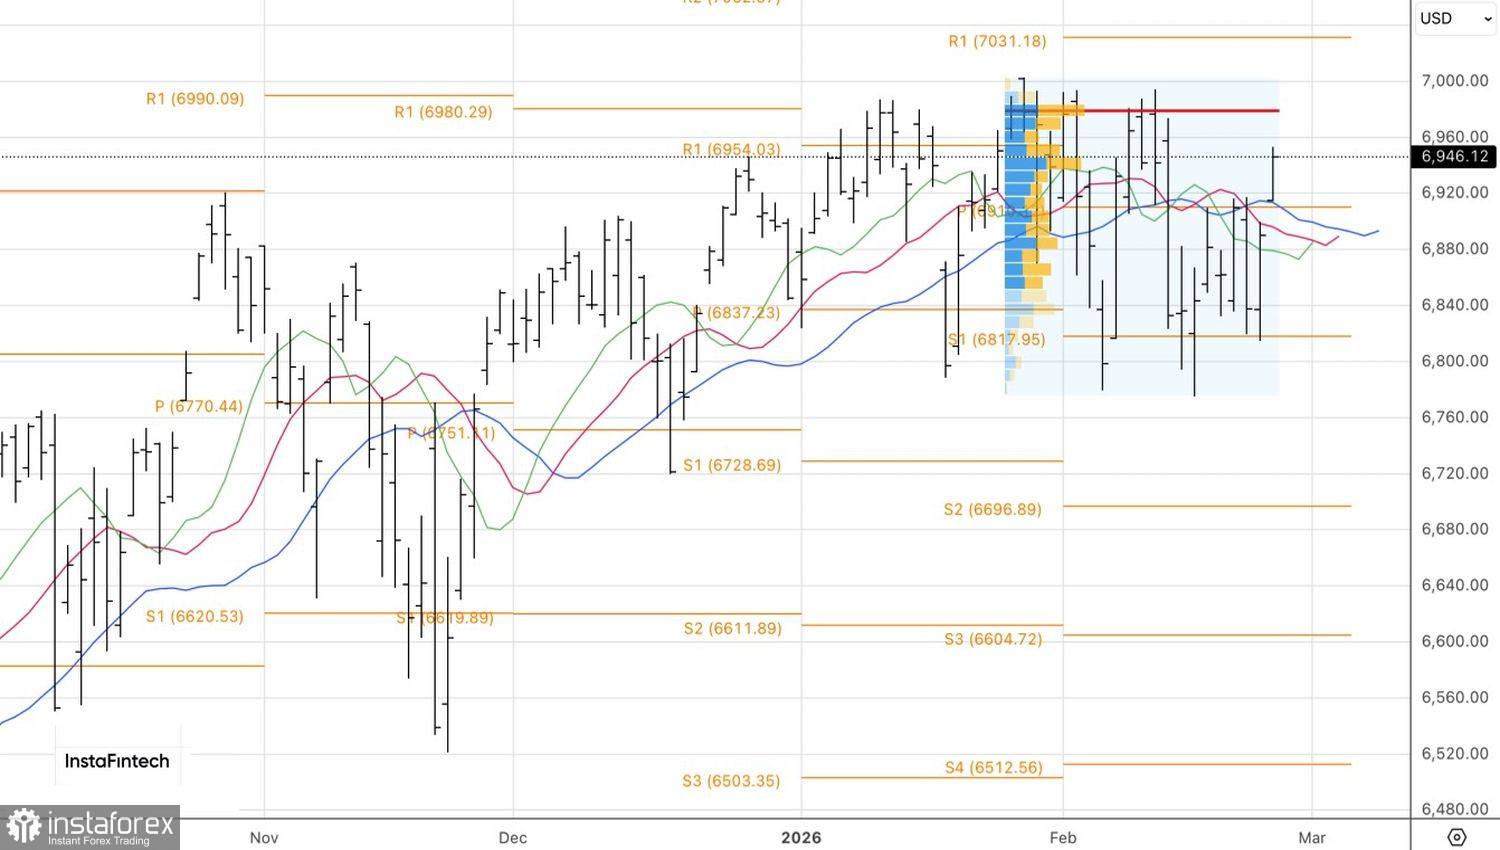
Technically, the S&P 500 chart shows a bullish crossover of moving averages, with prices consolidating above a key pivot level, which signals dominance by bulls. As long as prices stay above the 6,910 mark, it makes sense to stick with a buy strategy.


