Veja também

 27.04.2026 06:14 AM
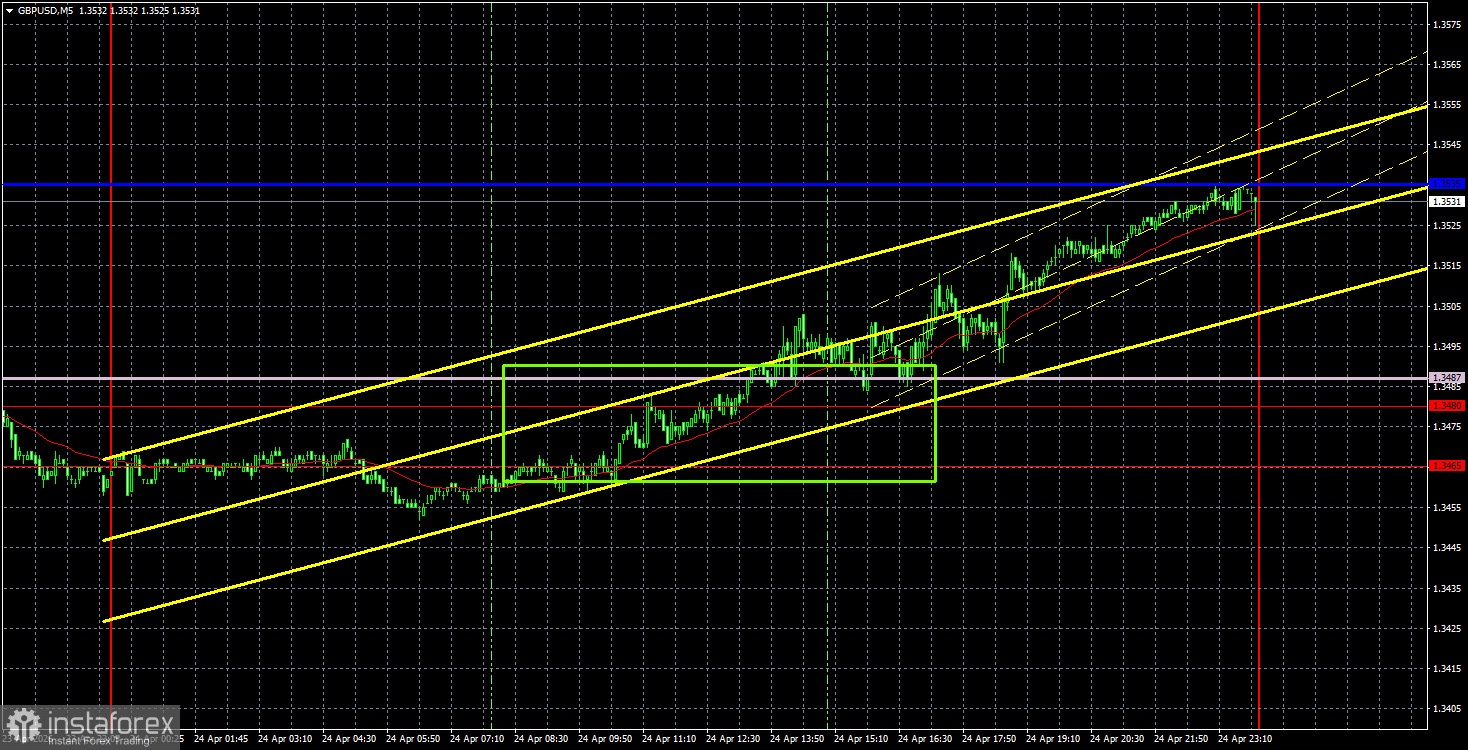
The GBP/USD pair rose by 70-80 pips on Friday, which could be attributed to the euro's rally, news about Abbas Araqchi, or the UK retail sales report. In my view, the most convincing reason is the first one. The euro was unable to break the Senkou Span B line, but it began to rise, pulling the British pound up with it. The UK retail sales report turned out to be better than expected, but the market had ignored much more important reports on inflation and unemployment just days prior. Therefore, there are few grounds to consider that the retail sales report triggered the pound's rise.
From a technical standpoint, the upward trend on the hourly timeframe remains intact, as the price is again above the Ichimoku indicator lines, and there are no trend lines for the British currency. Thus, technically, movement to the north may continue this week. We have seen the corrective wave. However, there are many important events scheduled for this week, and we do not know when the market will consider it time to react to them. Additionally, geopolitical news could arrive at any moment, and it remains key to the market, even though its influence has weakened in recent weeks.
On the 5-minute timeframe, one decent trading signal for buying was formed on Friday. During the European trading session, the price broke the 1.3465-1.3480 area and the Senkou Span B line, allowing traders to open long positions. By the end of the day, the British currency had only risen, and at the close of trading, a profit could be secured near the critical line.
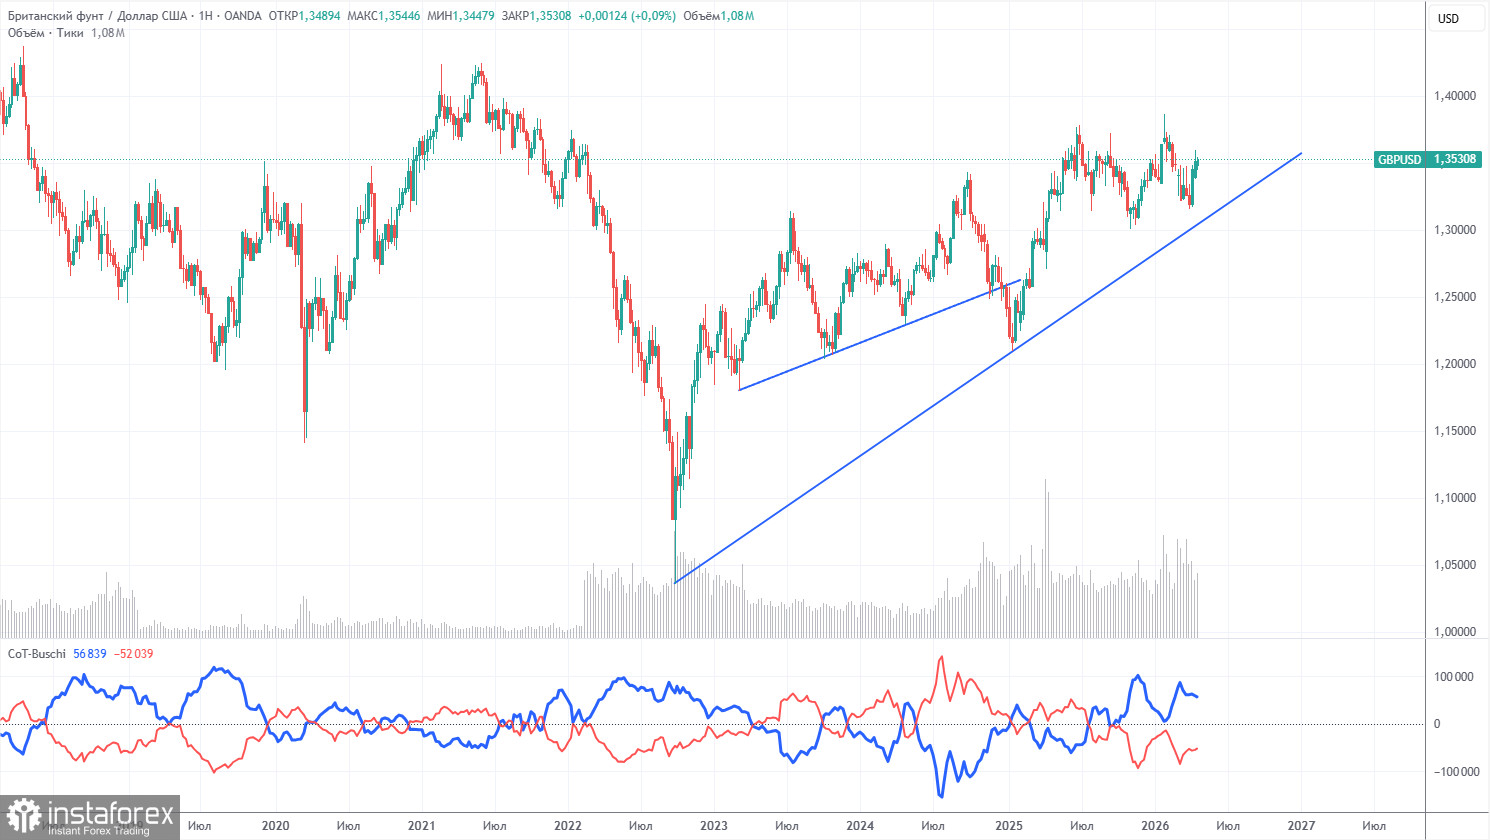
The COT reports for the British pound show that traders' sentiment has been shifting constantly in recent years. The red and blue lines representing the net positions of commercial and non-commercial traders frequently intersect and are usually close to zero. Currently, the lines are moving apart, with non-commercial traders still dominating with sales. However, considering events in the Middle East, it is no longer surprising that demand for risk currencies is falling and demand for the dollar is rising.
In the long term, the dollar continues to decline due to Donald Trump's policies, as clearly shown on the weekly timeframe. The trade war will continue in one form or another for a long time, and Trump's policies are aimed directly and indirectly at weakening the American currency. However, geopolitical factors currently take precedence, providing strong support for the dollar. Since the conflict in the Middle East cannot be considered resolved, the U.S. dollar may grow in the future. According to the latest COT report (from April 21), the "Non-commercial" group opened 8,100 BUY contracts and 5,500 SELL contracts. Thus, the net position of non-commercial traders increased by 2,600 contracts over the week.
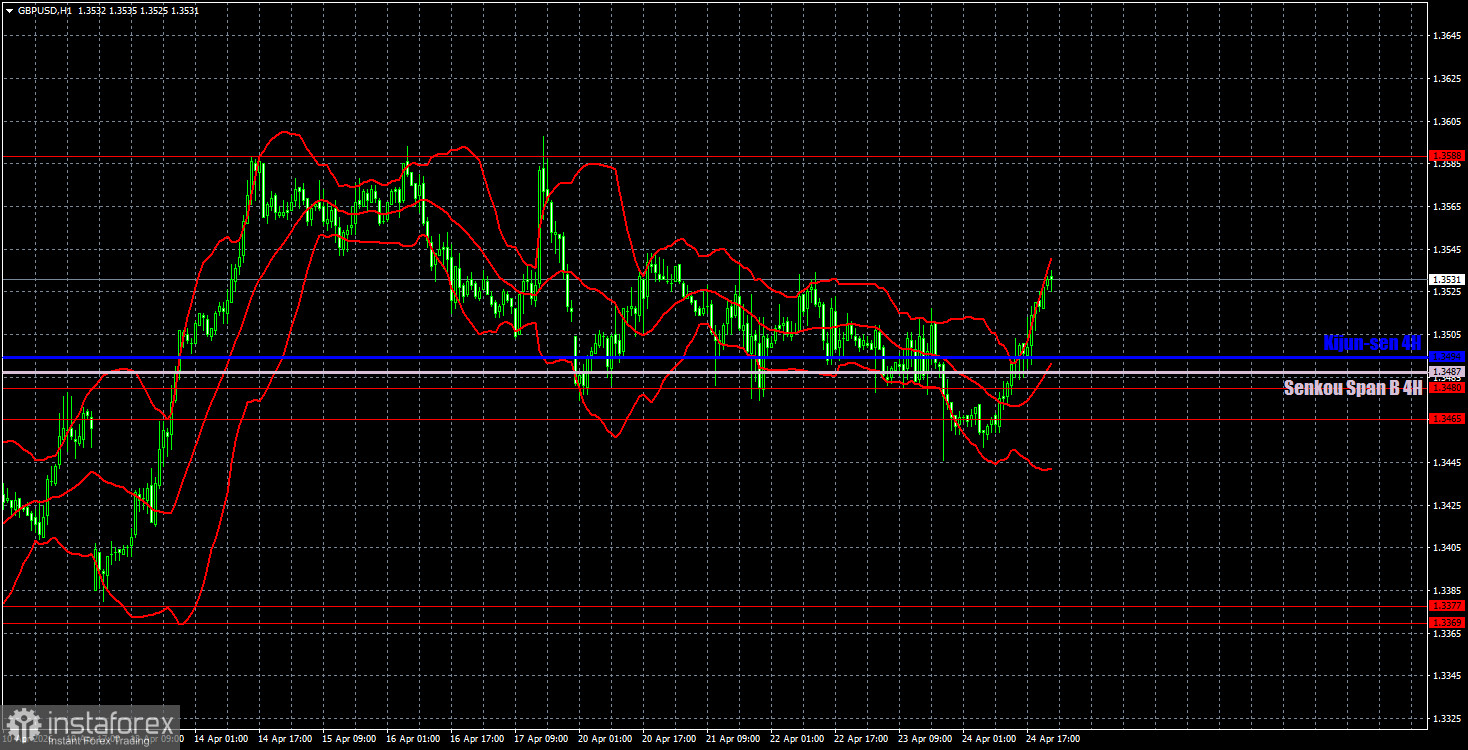
On the hourly timeframe, the GBP/USD pair continues to form an upward trend, which may be disrupted if a full-scale war resumes in the Middle East. It should be noted that the influence of geopolitics is weakening, as evidenced by recent movements, although military actions in the region are currently on hold. The Strait of Hormuz remains blocked, and there is no progress in negotiations.
For April 27, we highlight the following important levels: 1.3096-1.3115, 1.3179-1.3187, 1.3369-1.3377, 1.3465-1.3480, 1.3588, 1.3671-1.3681, 1.3751-1.3763. The Senkou Span B line (1.3487) and the Kijun-sen line (1.3494) may also serve as sources of signals. It is recommended to set a stop-loss order to break even if the price moves in the correct direction by 20 pips. The Ichimoku indicator lines may shift during the day, which should be taken into account when determining trading signals.
On Monday, there are no significant events scheduled in the UK or the US, so volatility is likely to be low, and the British pound may pull back from Friday's highs. On Monday, technical factors and geopolitics will take precedence.
Today, traders may consider short positions with a target of 1.3369-1.3377 if the price consolidates below the range of 1.3465-1.3480. Long positions can be opened with a target of 1.3588 if the price consolidates above the level of 1.3535 (the Kijun-sen line from Friday).
Price levels of support and resistance – thick red lines, around which the movement may end. They are not sources of trading signals.
Kijun-sen and Senkou Span B lines – lines of the Ichimoku indicator that are carried over to the hourly timeframe from the 4-hour one. They are strong lines.
Extreme levels – thin red lines from which the price has previously bounced. They are sources of trading signals.
Yellow lines – trend lines, trend channels, and any other technical patterns.
Indicator 1 on COT charts – the size of the net position of each category of traders.


