Veja também

 08.05.2026 07:14 AM
The situation in the cryptocurrency market remains unfavorable for traders. Despite the ongoing downward trend and the complete lack of signs of a shift toward a bullish scenario, Bitcoin has been rising for almost 3 months now. The nearest "bearish" FVG on Bitcoin's upward path has yielded only a very weak market reaction; however, the cryptocurrency's current rise cannot be considered strong. It remains a correction, but the first significant area of POI for sales was largely ignored (though the pattern is not yet invalidated). Thus, Bitcoin may now target the second-nearest bearish FVG, within which we will again expect the correction to complete and sell signals to form.
Yesterday, the first cryptocurrency slightly declined in price, which many quickly linked to another unflattering statement from Donald Trump regarding Iran. Recall that just on Wednesday, the US president stated that a framework agreement could soon be signed with Tehran, serving as a starting point for a full-fledged deal. However, Tehran has again not confirmed Trump's words. On Thursday, Trump stated that Iran must agree to a deal; otherwise, bombings will resume. Thus, the balance of geopolitical factors continues to sway back and forth. The growth of Bitcoin over the past three months has been stable but neither strong nor impulsive.
Meanwhile, prominent crypto analyst Tom Lee has reported that a close above $76,000 in May would signal a transition to an upward trend for Bitcoin. Lee noted that Bitcoin has never been in a bearish trend after three months of continuous growth. However, this correlation seems quite weak. Recall that Bitcoin has also never closed the year immediately following a "halving" with a negative result. Moreover, Bitcoin has always corrected after completing a "bullish" trend by at least 70-80%.
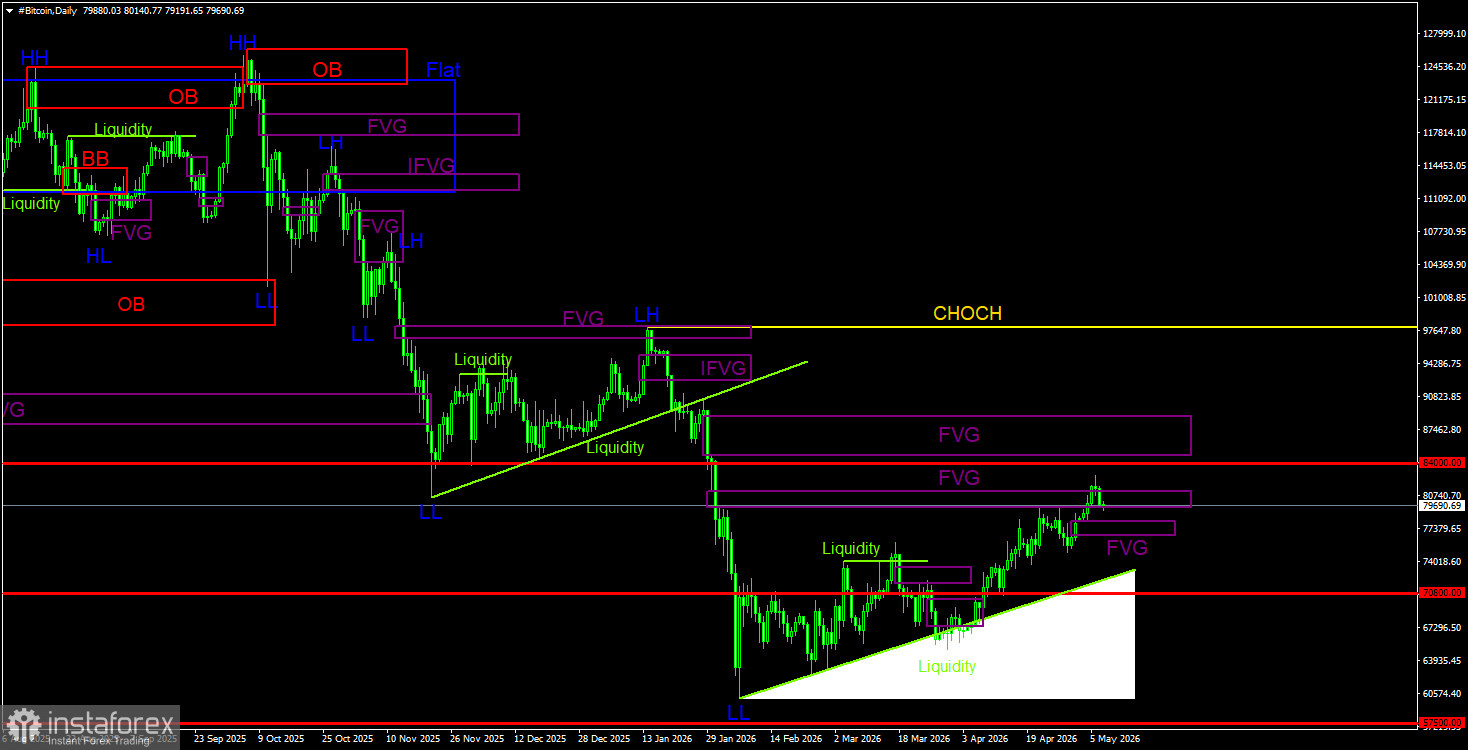
On the daily timeframe, Bitcoin continues to form a downward trend and a correction against it. The trend structure is bearish, and the CHOCH line remains at $97,900. Only above this level can it be considered that the downward trend has concluded. Since there are no signs of a trend reversal to an upward movement, we expect a decline to resume sooner or later. On the daily timeframe, the nearest POI for new sell trades is in the range of $79,500–$81,100. However, this area has been tested twice, and the price reaction has been very weak. Consequently, this pattern is likely to be invalidated, and Bitcoin may continue to rise to the next FVG in the range of $84,900-$88,800. The liquidity pool below the trend line remains a price target. A small bullish FVG has also formed. A reaction to it may signal a continuation of the correction and allow traders to open small long positions.
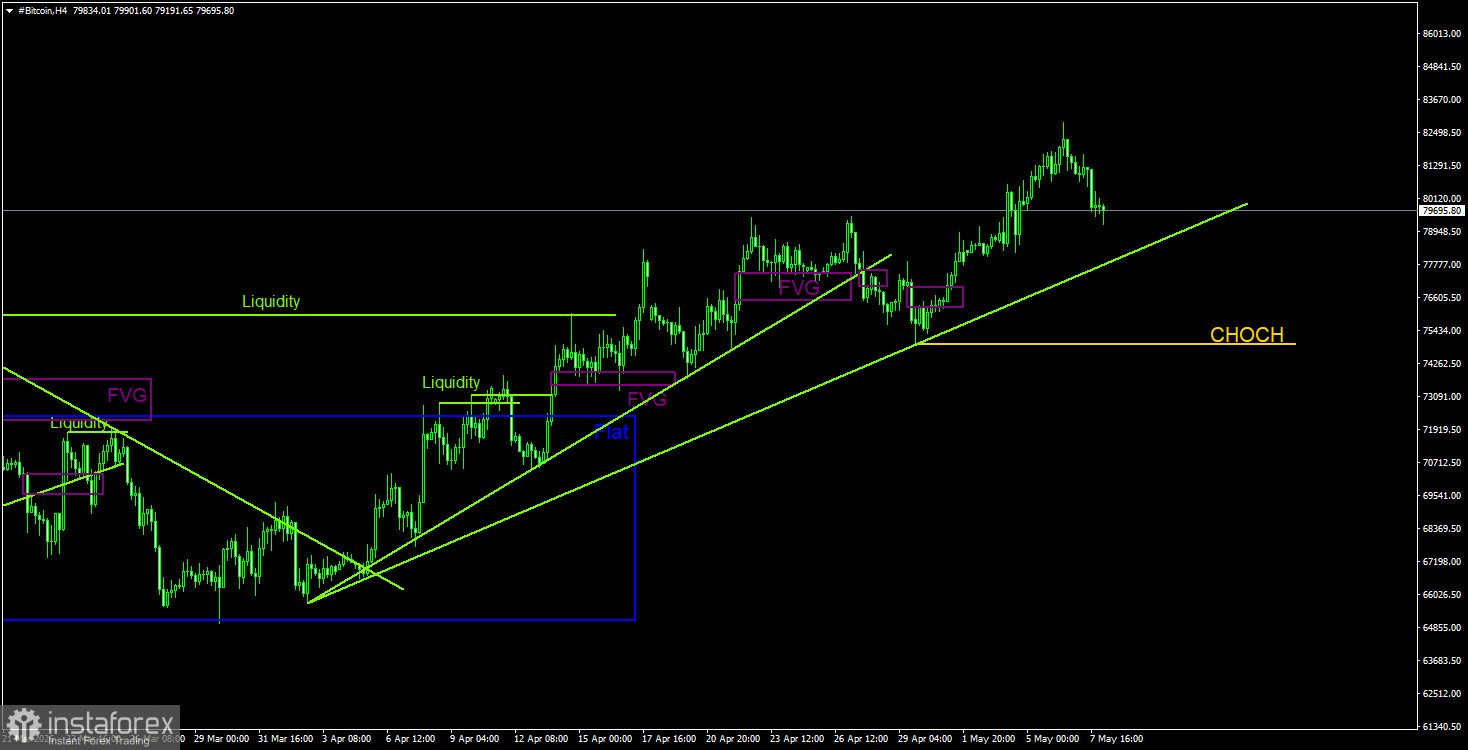
On the 4-hour timeframe, Bitcoin continues its upward movement, which remains a mere correction. The CHOCH line of the current upward structure is now at $74,950; a consolidation below this level will signal a potential trend change. The completion of the upward trend on the 4-hour timeframe may serve as a starting point for a new trend on the daily timeframe. There are still no fundamental grounds for strengthening Bitcoin.
Bitcoin continues to form a full-fledged downward trend and a correction against it. We continue to anticipate a decline with a target of $57,500 (the 61.8% Fibonacci level of the three-year upward trend), and there are currently no signs of a trend reversal. Among the POIs at this time, we can only highlight the nearest bearish FVG on the daily timeframe located in the range of $79,300 - $81,200. It has not been completely invalidated yet, but may be soon. In this case, the POI for sales will be in the range of $84,900 - $88,800. The targets for decline remain below the $60,000 level. For long positions, the only available bullish FVG can be used, but it is important to remember that the current movement is a correction.


