
Veja também


 07.09.2026 09:47 AM
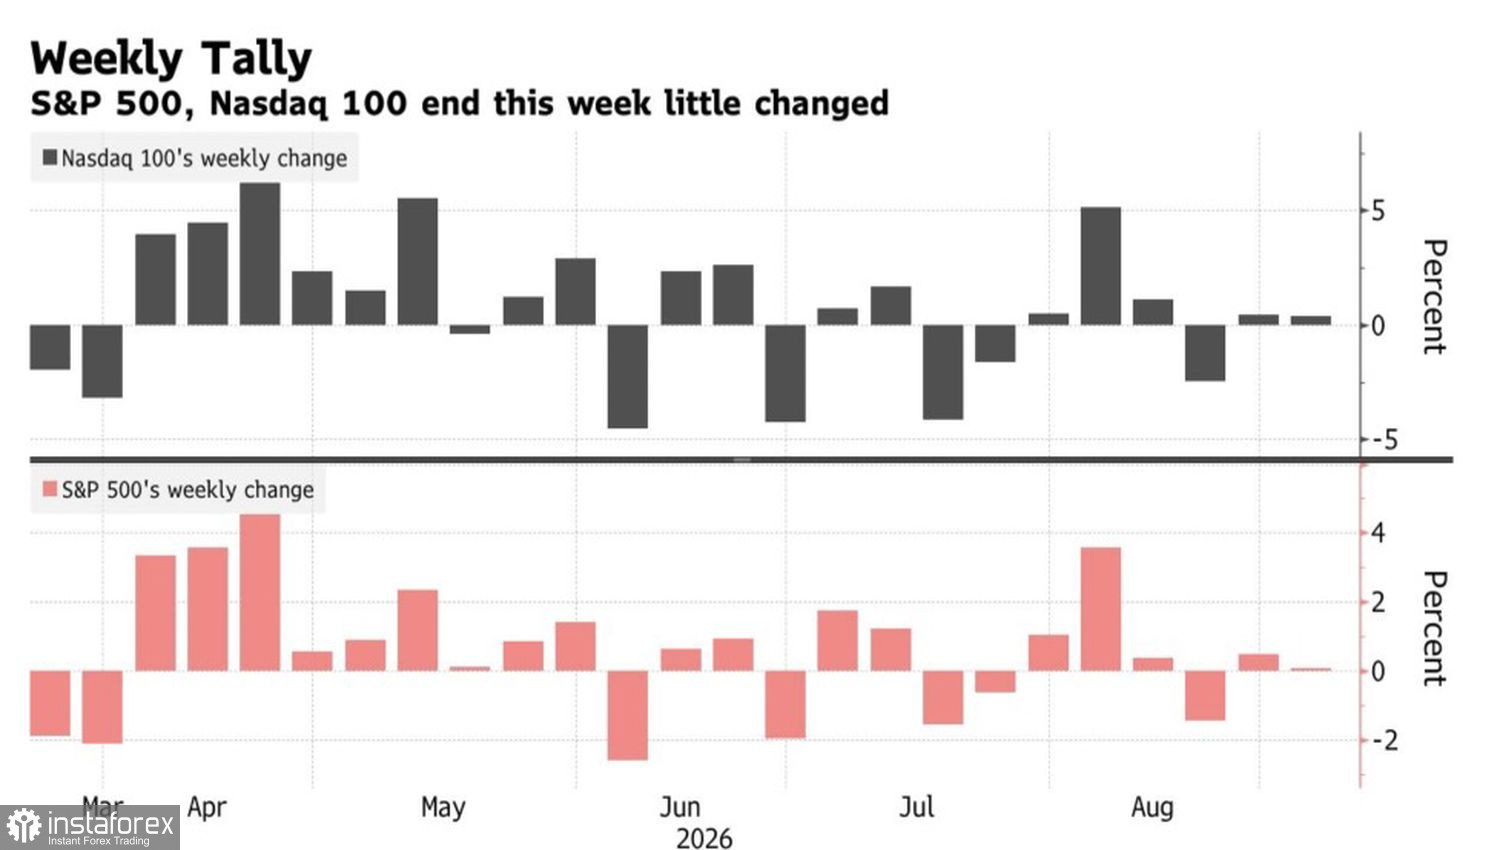
The US economy added 162,000 jobs in August, nearly three times consensus, marking a sharp rebound from July's 21,000. What's good news for the labor market has turned into bad news for equities: the S&P 500 closed lower, with consumer discretionary, healthcare and energy among the biggest decliners.
Stock index performance
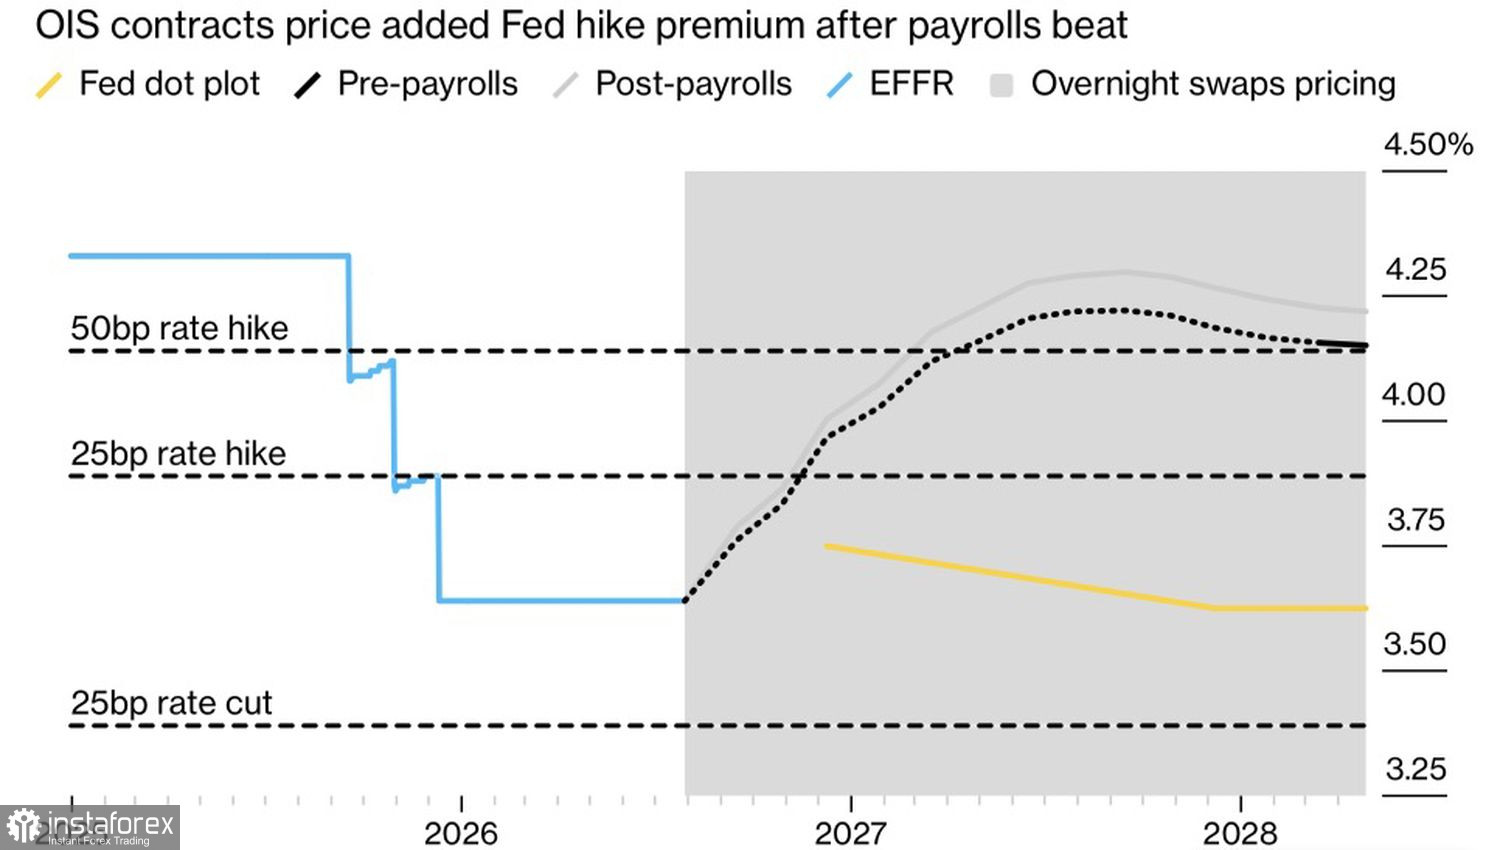
Why? Strong payrolls remove the Fed's clearest excuse to hold off on a Sept. 16 rate hike. The odds of tightening jumped from 52% to 60% immediately after the release. UBS Group now models two rate hikes, in September and December, even as US President Donald Trump called for lower interest rates, citing a "much stronger" US credit picture. Markets, however, clearly fear the opposite scenario.
Meanwhile, the Wall Street fear gauge, the VIX, sits calmly around 14,more than 20% below its annual average, as if unaware of the nervousness beneath the surface. And there is reason to be uneasy: utilities, normally the market's quietest sector, are now one of the two worst performers year?to?date after an extraordinary surge of over 11% through late February.
Dynamics of market expectations for Fed funds rate
That quiet is the key signal. Utilities have long been the canary in the coal mine for equities — the sector most sensitive to the pace of Fed tightening because it depends on cheap borrowing and steady dividends. History supports the metaphor: the Dow Jones Utility Average led the S&P 500 peak in 21 of the last 30 bull-market tops since 1930, and after each such lead, indices have retraced more than 29% on average.
For now, the upswing is intact and corporate profits continue to feed the rally — the S&P 500 is up about 13% year-to-date. The question is how long that buffer will hold. Traders are shifting focus to Friday's consumer price data. Those numbers, not a single jobs report, will decide whether inflation stays above the Fed's 2% target and whether the central bank must tighten further.
So the market is in an uncomfortable trap: the stronger the economy, the scarier it looks for investors. Will Wall Street heed the canary's warning before it is too late?
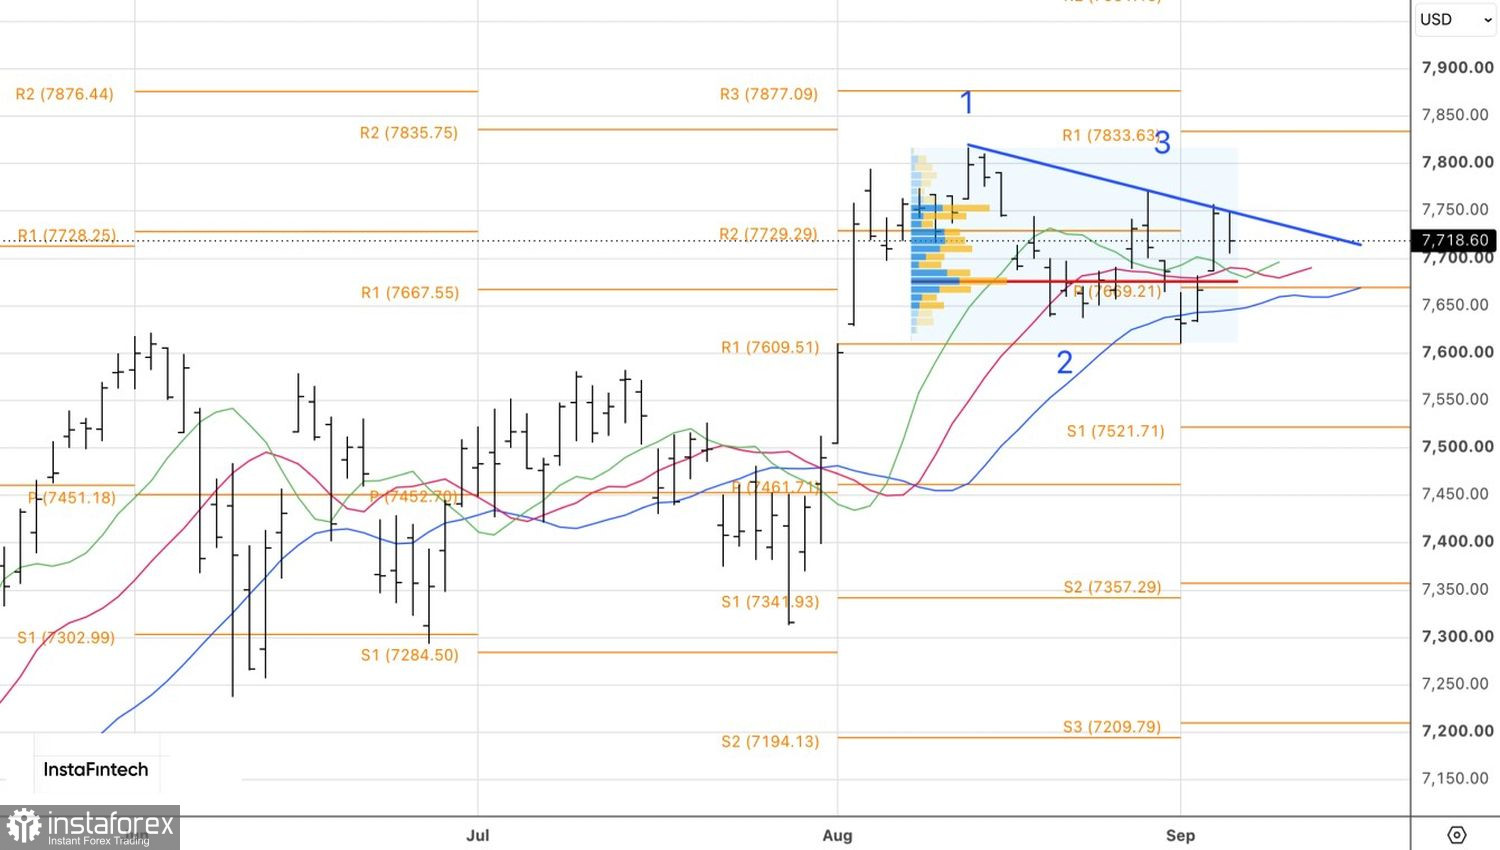
Technically, the daily S&P 500 chart shows a bounce off the trendline within a Three Touch pattern. The 1-2-3 reversal scenario can still be revived. A break below fair value at 7,675 would be a sell signal. Conversely, reclaiming levels above 7,755 would give bulls reason to buy.
You have already liked this post today
*A análise de mercado aqui postada destina-se a aumentar o seu conhecimento, mas não dar instruções para fazer uma negociação.


