
Veja também


 16.11.2026 09:41 AM
Analysis:
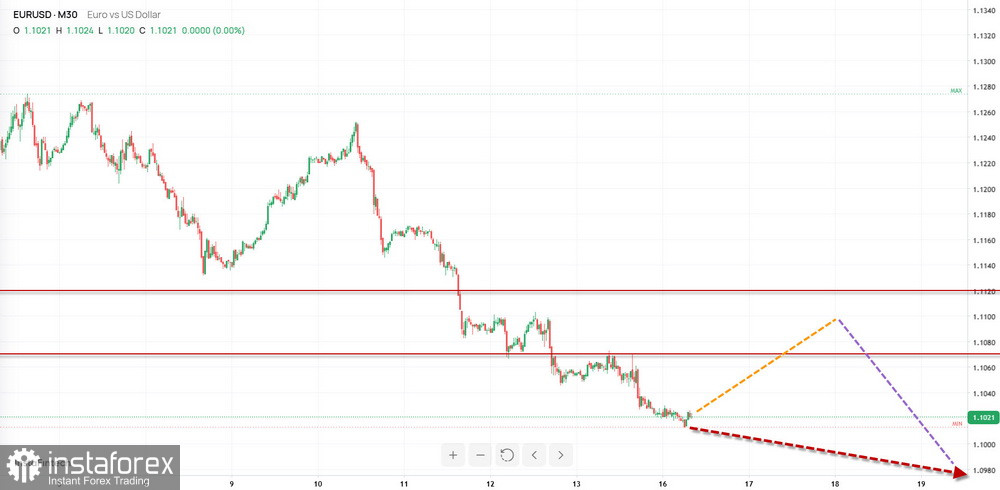
Since the end of January this year, the price movement of the euro in its main currency pair has been determined by a downward wave. On the daily time frame, this segment represents a correction of the preceding upward trend. The wave structure remains incomplete at the time of analysis. The final part of this wave formation has been developing since November 4.
Forecast:
At the beginning of the upcoming week, the EUR/USD chart is expected to show sideways price movement. An upward move toward the resistance zone is possible. Increased volatility, a reversal, and a resumption of the downward movement can be expected in the second half of the week. The nearest opposing zones are expected to limit the pair's weekly trading range.
Potential Reversal Zones
Resistance:
Support:
Trading Recommendations:
Selling: Short positions may be considered after appropriate signals appear near the resistance zone.
Buying: Long positions are risky and may result in losses.
Analysis:
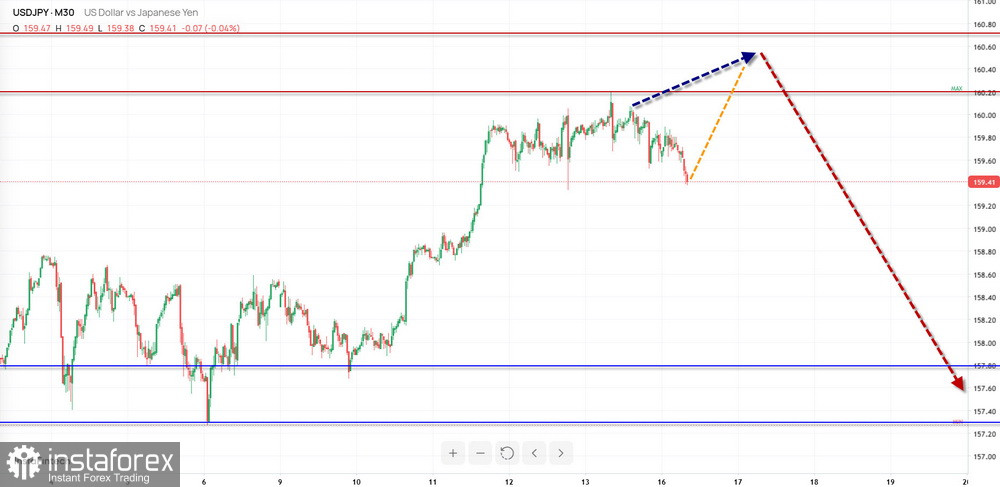
Since the beginning of September, the USD/JPY pair has been forming an upward wave, which remains incomplete. Since October 23, the price has been developing its final segment (C). The estimated resistance level is located within a potential reversal zone on the daily time frame.
Forecast:
Over the next couple of days, the USD/JPY pair is expected to move predominantly sideways along the boundaries of the resistance zone. Subsequently, a reversal and the beginning of a downward price movement are highly likely. A breakout beyond the calculated zones during the current week is unlikely.
Potential Reversal Zones
Resistance:
Support:
Trading Recommendations:
Selling: Short positions will become relevant after reversal signals appear near the resistance zone on the trading systems being used.
Buying: Long positions have limited potential and may result in losses.
Analysis:
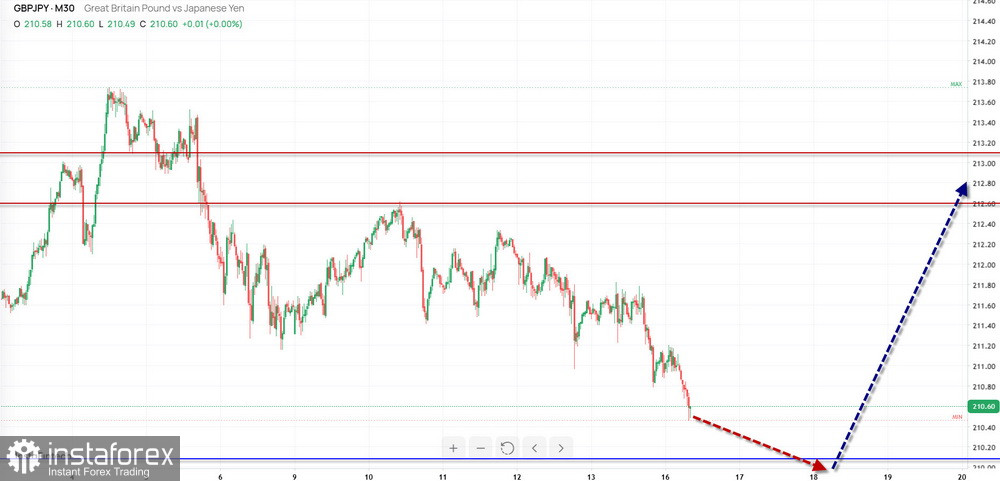
The short-term trend direction of the GBP/JPY pair is determined by the upward wave that began on September 8. Since November 4, the pair has been developing a corrective structure along a strong resistance zone in the form of an extended or running flat. At the time of analysis, its structure does not indicate that the middle segment (B) has been completed.
Forecast:
Over the next few days of the upcoming week, the downward movement is expected to reach completion near the support zone. Closer to the weekend, a reversal and a resumption of the upward movement toward resistance levels can be expected. A breakout beyond the calculated zones during the current week is unlikely.
Potential Reversal Zones
Resistance:
Support:
Trading Recommendations:
Selling: Short positions may be opened in smaller portions during individual trading sessions, with potential gains extending toward the support zone.
Buying: Long positions will become relevant after confirmed reversal signals appear near the support zone on the trading systems being used.
Analysis:
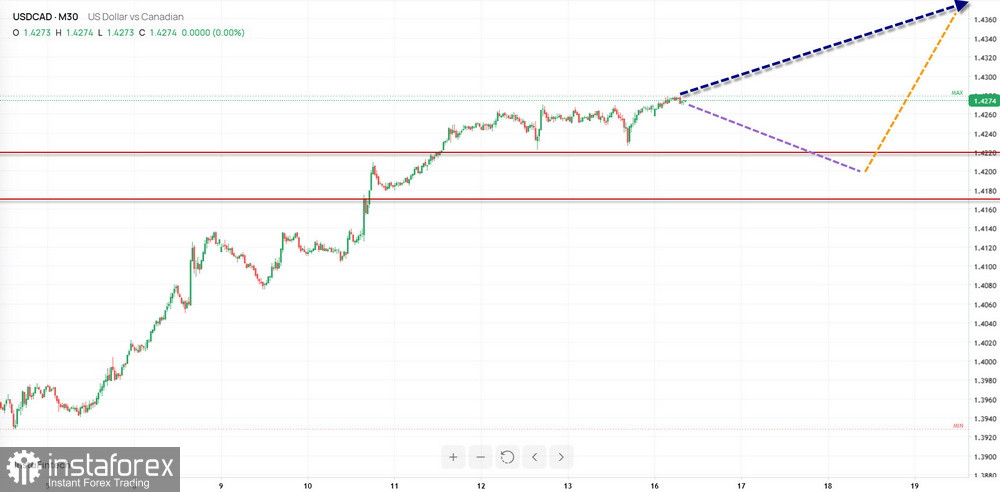
Since the end of August this year, the short-term trend direction of USD/CAD has been determined by a bullish wave. Its structure remains incomplete at the time of analysis. The final part of the wave has been developing since mid-June. Last week, the price broke through an intermediate resistance level, which subsequently turned into support.
Forecast:
At the beginning of the upcoming week, predominantly sideways price movement is expected. A decline toward the boundaries of the calculated support zone cannot be ruled out. Toward the end of the week, the likelihood of increased volatility and a resumption of the upward price movement will rise.
Potential Reversal Zones
Resistance:
Support:
Trading Recommendations:
Buying: Long positions will become relevant after appropriate signals appear on the trading systems being used.
Selling: Short positions have limited potential and may result in losses.
Brief Analysis:
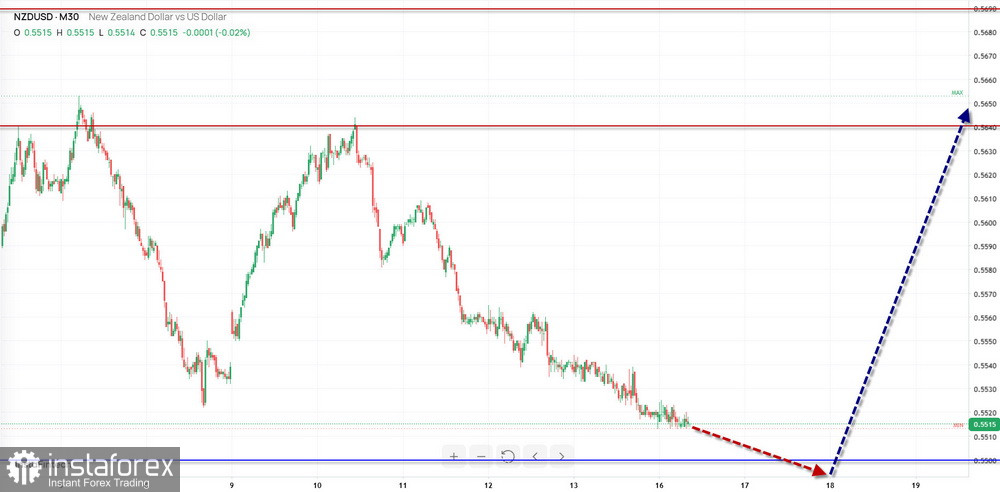
Since January this year, fluctuations in the New Zealand dollar have followed the pattern of a downward wave. In October, the price reached the upper boundary of a broad support zone on the weekly time frame. The wave structure is nearing completion. Last week, the price moved into a horizontal consolidation phase along a breached support zone that has now turned into resistance.
Weekly Forecast:
At the beginning of the upcoming week, sideways movement with a downward bias is expected to continue toward the support zone. A reversal and a subsequent rise in the exchange rate may follow. A change in direction is more likely in the second half of the week. The highest level of trading activity should be associated with the release of important economic data.
Potential Reversal Zones
Resistance:
Support:
Trading Recommendations:
Selling: Short positions have limited potential, capped by the support zone.
Buying: Long positions may be considered after confirmed reversal signals appear near the support zone.
Brief Analysis:
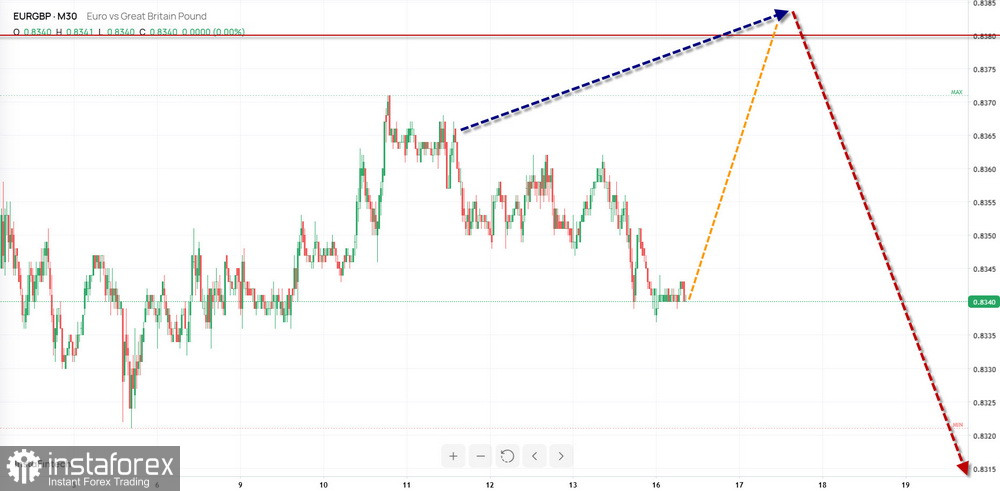
The incomplete segment of the dominant downward flat pattern in the EUR/GBP pair has been developing since September 25. The price is approaching the upper boundary of a broad potential reversal zone on the weekly time frame. An intermediate corrective structure is developing and remains incomplete at the time of analysis.
Weekly Forecast:
During the first half of the current week, predominantly sideways movement with an upward bias is expected. Any appreciation is likely to remain within the resistance zone. Subsequently, a resumption of the downward price movement is highly likely. The calculated support zone indicates the lower boundary of the expected weekly trading range.
Potential Reversal Zones
Resistance:
Support:
Trading Recommendations:
Selling: Short positions may be considered after appropriate indicator signals appear near the calculated resistance zone on the trading systems being used.
Buying: Long positions may be considered with reduced position sizes during individual trading sessions. Given the limited potential, position sizes should be reduced.
Analysis:
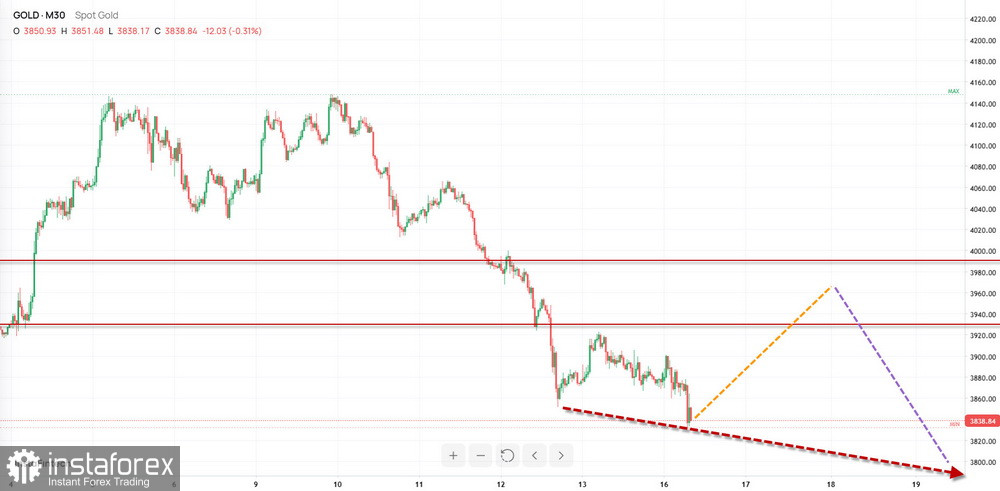
In the short term, the direction of gold price movements has been determined by a downward wave since the end of August. In the daily time frame, this wave is correcting the latest segment of the dominant trend. The corrective structure does not yet appear complete. The price is forming a running flat pattern on the chart.
Forecast:
Sideways price movement may continue over the next couple of days. A retracement toward the resistance zone is likely, potentially including a brief move above its upper boundary. A subsequent change in direction and a resumption of the downward movement are expected. Increased volatility and a change in the instrument's direction are more likely closer to the weekend.
Potential Reversal Zones
Resistance:
Support:
Trading Recommendations:
Selling: Short positions may be considered after appropriate confirmed signals appear in the resistance zone.
Buying: Long positions have limited potential and involve considerable risk.
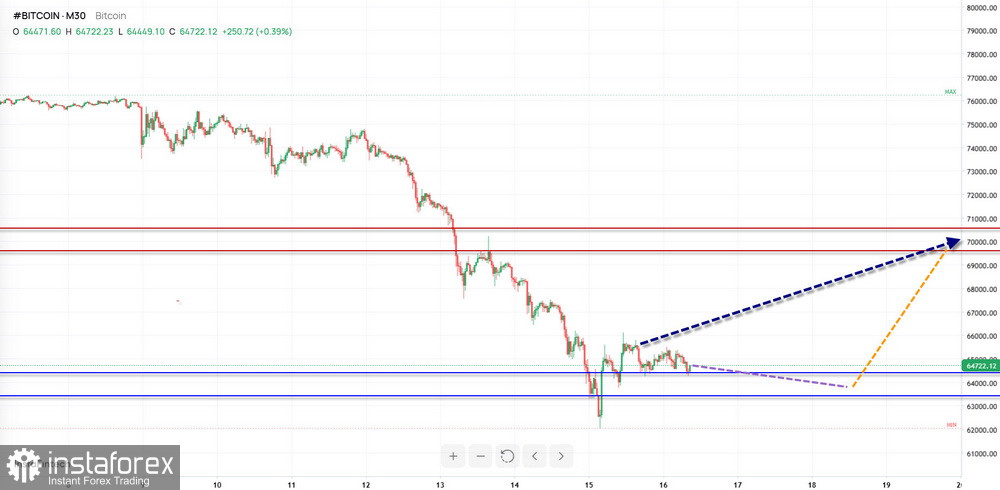
Since the end of August, a downward corrective wave pattern in the form of an extended flat has been developing on the Bitcoin chart. The final segment (C) is currently forming. Its structure remains incomplete at the time of analysis. The target zone is located within a strong potential reversal zone on the higher time frame.
Forecast:
Over the next couple of days, sideways consolidation is the most likely scenario. Temporary downward pressure toward the lower boundary of the calculated support zone is possible. Closer to the weekend, a change in direction and the beginning of an upward price movement can be expected, potentially extending toward the resistance zone.
Potential Reversal Zones
Resistance:
Support:
Trading Recommendations:
Selling: Short positions may be considered after appropriate signals appear near the resistance zone.
Buying: Long positions are premature until the current downward movement has been completed.
Explanatory Notes: In Simplified Wave Analysis (SWA), all waves consist of three segments (A-B-C). The latest incomplete wave is analyzed on each time frame. Expected price movements are indicated by dashed lines.
Important: The wave algorithm does not take into account the duration of price movements over time!


