
Veja também


 18.11.2026 09:00 AM
Bitcoin is holding around $65,000 after falling to $62,000 on Sunday, and the main argument for a nearby bottom this time comes from on-chain data. According to Glassnode, investors' realized losses — i.e., losses from selling coins below their purchase price — have risen relative to realized gains over the past year to levels seen only at the lows of 2018, 2020, 2022 and early 2023.

Most of the selling came from recent buyers. Holders of coins younger than six months booked losses earlier this year, took profits during the September–October rally, and are now selling again at a loss. Leverage has also been flushed out: November 13–14 saw some of the largest long liquidations relative to open interest since 2023, and about $2 billion of positions were force-closed over the weekend. Recall that in early October most short-term holders were in profit; on November 11, some 47,300 BTC were sent to exchanges at a loss in a single day, meaning the shift from profit-taking to mass loss-realization took roughly six weeks.
There are early signs of demand. On the two worst days, buyers absorbed roughly 66,000 BTC in the $62,000–$66,000 range. However, 90-day stablecoin supply has shrunk by 4.2%. Outflows from US spot BTC ETFs extended to an eighth session, with about $2.2 billion leaving those funds since early November. That is negative for the crypto market.
The key range remains $62,000–$66,000. Earlier talk focused on a drop to $50,000–$59,000. A confirmed bottom would require a return above $74,100 — the average cost basis of short-term holders — which is roughly 14% above current levels.
All this suggests seller pressure is close to exhaustion, but there is no confirmation of a reversal yet. I expect bitcoin to remain in the $62,000–$65,000 range, with another test of the lower bound before Anthropic's trading begins on Thursday; a close below $62,000 would open the path to $58,500 and possibly a touch of $53,700. The market will only turn decisively higher if ETF outflows stop.
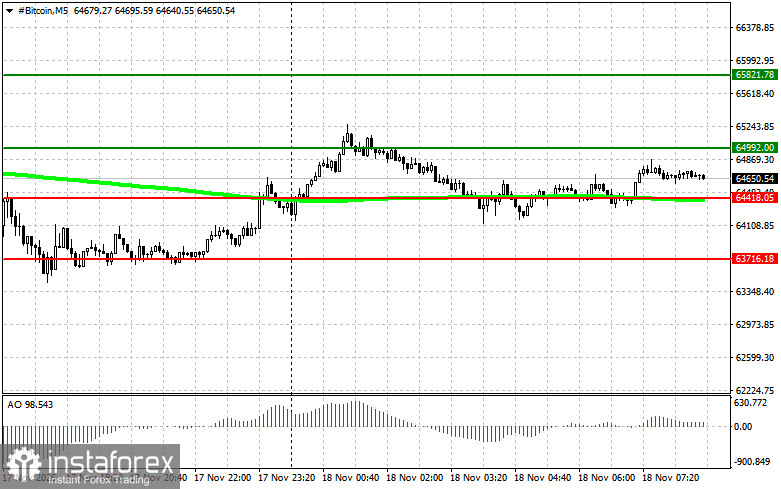
Price trades between nearest support at 64,400 and nearest resistance at 64,900, and the plan centers on two mirror directions with a full set of breakout and bounce scenarios. For buying, I look for a confirmed breakout above 64,900 with a target of 65,800 — where to take profits and watch for a short on the pullback — provided price is above the 50-day moving average, and the Awesome Oscillator is above zero. If a break below 64,400 fails and proves a false spike, buyers can push price back to 64,900 and then toward 65,800.
For selling, the key is a confirmed break below 64,400, targeting 63,700, provided the moving average is above price and the Awesome is below zero. If an upside break above 64,900 fails to confirm, sellers can push price back to 64,400 and then to 63,700.
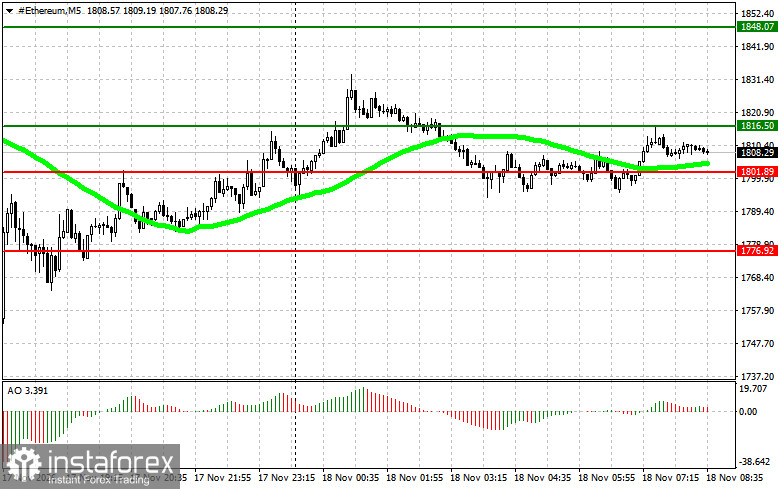
The logic fully mirrors Bitcoin on its own price scale. The working range sits between support at 1,801 and resistance at 1,816. Buy positions are considered on a confirmed close above 1,816 with a target of 1,848, provided price is above the 50-day MA and the Awesome Oscillator is above zero — and also on a false break below 1,801 followed by a return to 1,816 and then 1,848. Consider sell positions on a confirmed break below 1,801, targeting 1,776, provided the MA is above price and the Awesome Oscillator is below zero; also on a failed break above 1,816 followed by a return to 1,801 and then 1,776. Both indicators serve as filters to weed out false moves rather than standalone entry signals; decisions are taken only after price actually confirms the specified levels.


