
Veja também


 19.11.2026 06:05 AM
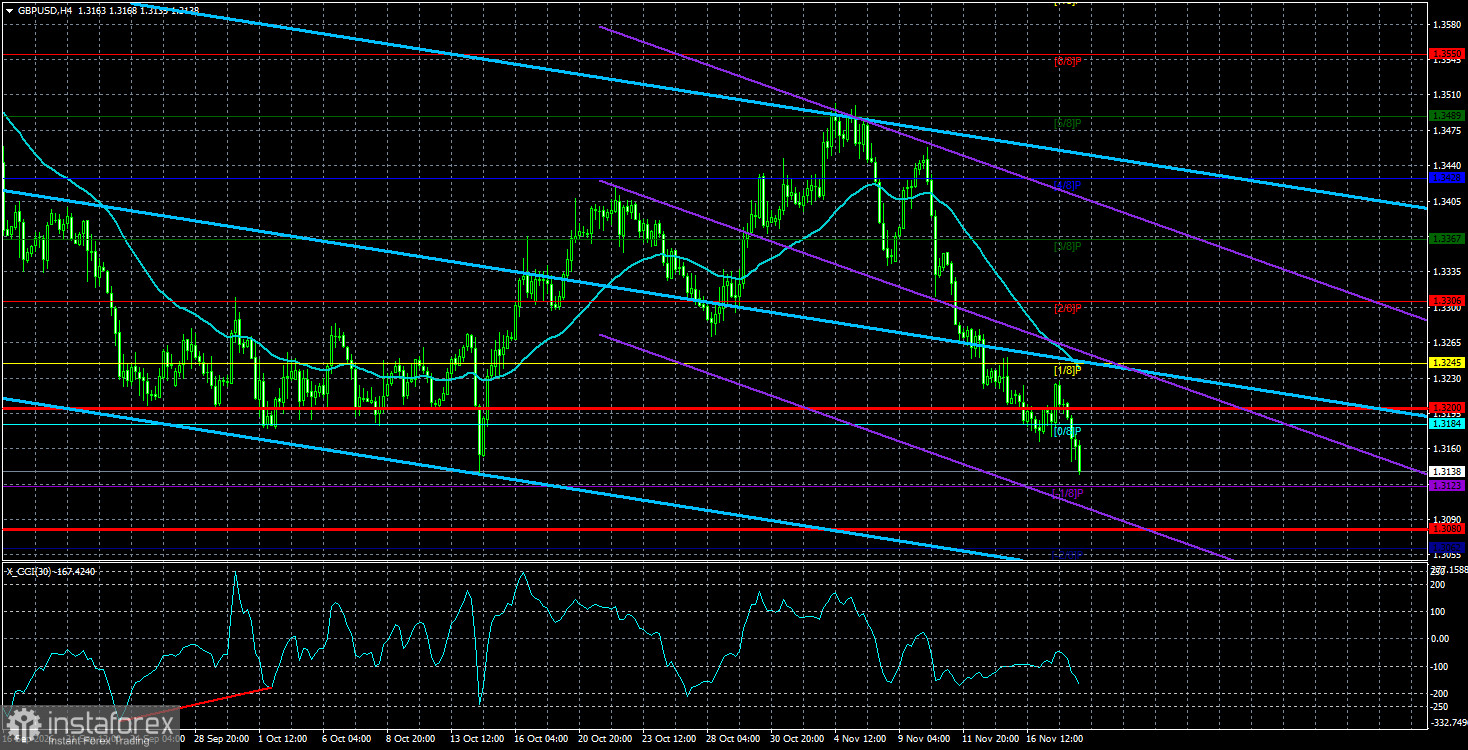
The GBP/USD currency pair also continued its downward movement on Wednesday, remaining near an extreme support area. Recall that the 1.3150–1.3180 zone is the lower boundary area of two sideways channels on the daily and weekly timeframes. If desired, it can be extended to 1.3100–1.3180. In any case, the pound is now at a make-or-break point. If the indicated area holds against the bears, the pound will remain flat, with a good chance to rally toward the upper boundary of the daily sideways channel at 1.3650 at minimum—and potentially resume the 2022 global uptrend. If the zone fails, the pound will continue to fall, and the market will need no justification to sell it, just as it doesn't need reasons to sell the euro now.
Interestingly, traders did have a reason to open shorts on Wednesday. UK inflation for October showed a smaller acceleration than expected. The market expected a rise to 3.7%, but CPI actually increased only to 3.6%. Thus, inflation accelerated less than forecast, which could reduce the Bank of England's "hawkish" impulse. So two inflation prints are now determining GBP/USD's fate at the end of 2026. The US inflation report omitted the year-on-year reading, and the monthly reading beat forecasts by 0.1%. The UK inflation report showed acceleration, but it was 0.1 percentage point below expectations. The result: the pound fell about 300 pips. And just days before the US CPI publication, the Bank of England raised rates— but it didn't save the pound from falling.
Therefore, the conclusions we drew in the EUR/USD article apply to GBP/USD as well. A few weeks ago the pound traded quite logically and displayed signs of orderly movement. Then the market seemingly woke up and asked: why is only the euro being sold? It began selling the pound as well. By the end of the week, "hawkish" Fed expectations may strengthen further, and if Friday's UK retail sales print disappoints (below the 0% forecast), the pound could drop another 100 pips. Still, for now we expect the flat on the daily timeframe to hold.
In short: the pound still retains some pride. While the euro showed a clear decline in 2026, the pound spent the year largely in a sideways channel. Geopolitics no longer supports the dollar, yet the market sees only Fed rate hikes and ignores other factors, interpreting each macro release in the dollar's favor. We repeatedly note that many market moves are neither logical nor fundamental; traders should recognize when the market trades on news and events and when it trades purely on technicals and speculative momentum.
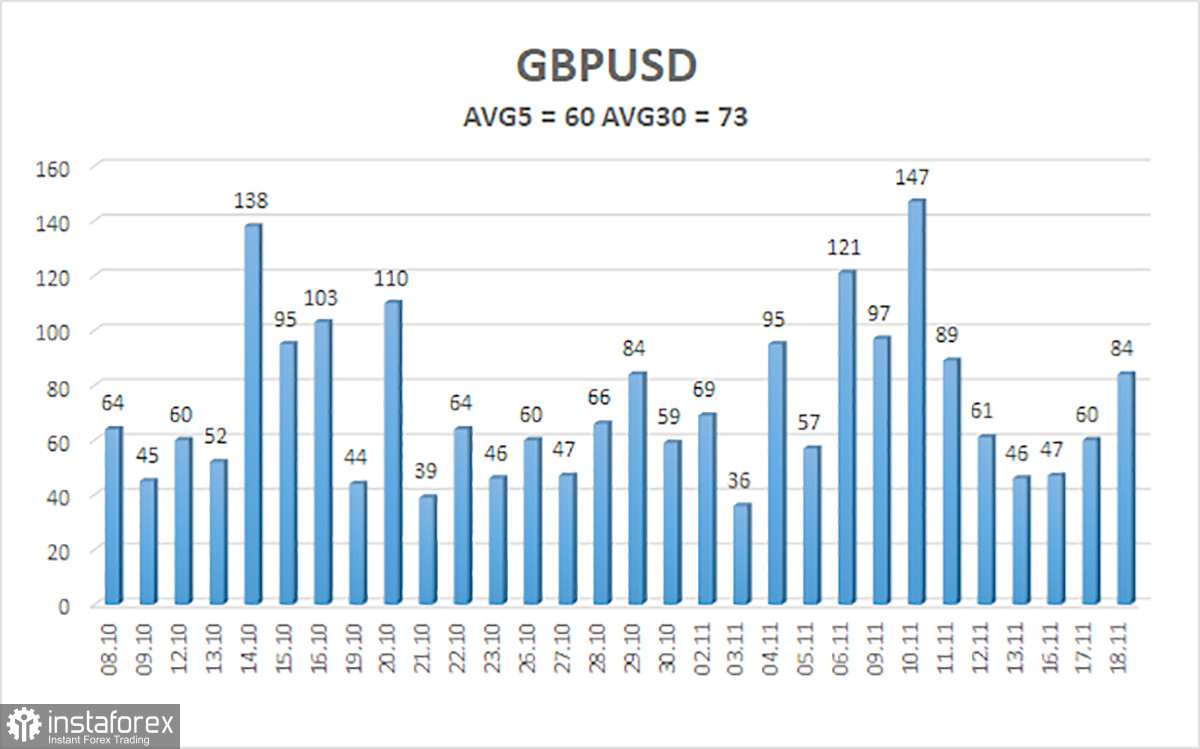
The average volatility of the GBP/USD pair over the last 5 trading days is 60 pips. For the pound/dollar pair, this value is "average." On Thursday, November 19, we therefore expect movement within the range bounded by the levels 1.3080 and 1.3200. The higher linear regression channel is directed downward, indicating a downtrend. The CCI indicator has recently not entered overbought/oversold areas and has not formed divergences.
S1 – 1.3123
S2 – 1.3062
R1 – 1.3184
R2 – 1.3245
R3 – 1.3306
The GBP/USD currency pair has entered a new downward trend within a sideways channel on the daily timeframe. 2026 has been very positive for the dollar because geopolitics and inflation forced capital to seek safety and brought the Fed back to tightening monetary policy. However, on the weekly timeframe, price remains flat between 1.3150 and 1.3780 within a four-year uptrend, supporting the prospect of pound appreciation in the medium term. Consider long positions with targets of 1.3367 and 1.3428 when price is above the moving average. With the price below the moving average, trade to the downside with targets of 1.3123 and 1.3080. Be careful with short positions — the price is near the lower bounds of the sideways channels.


