
Veja também


 20.11.2026 06:26 AM
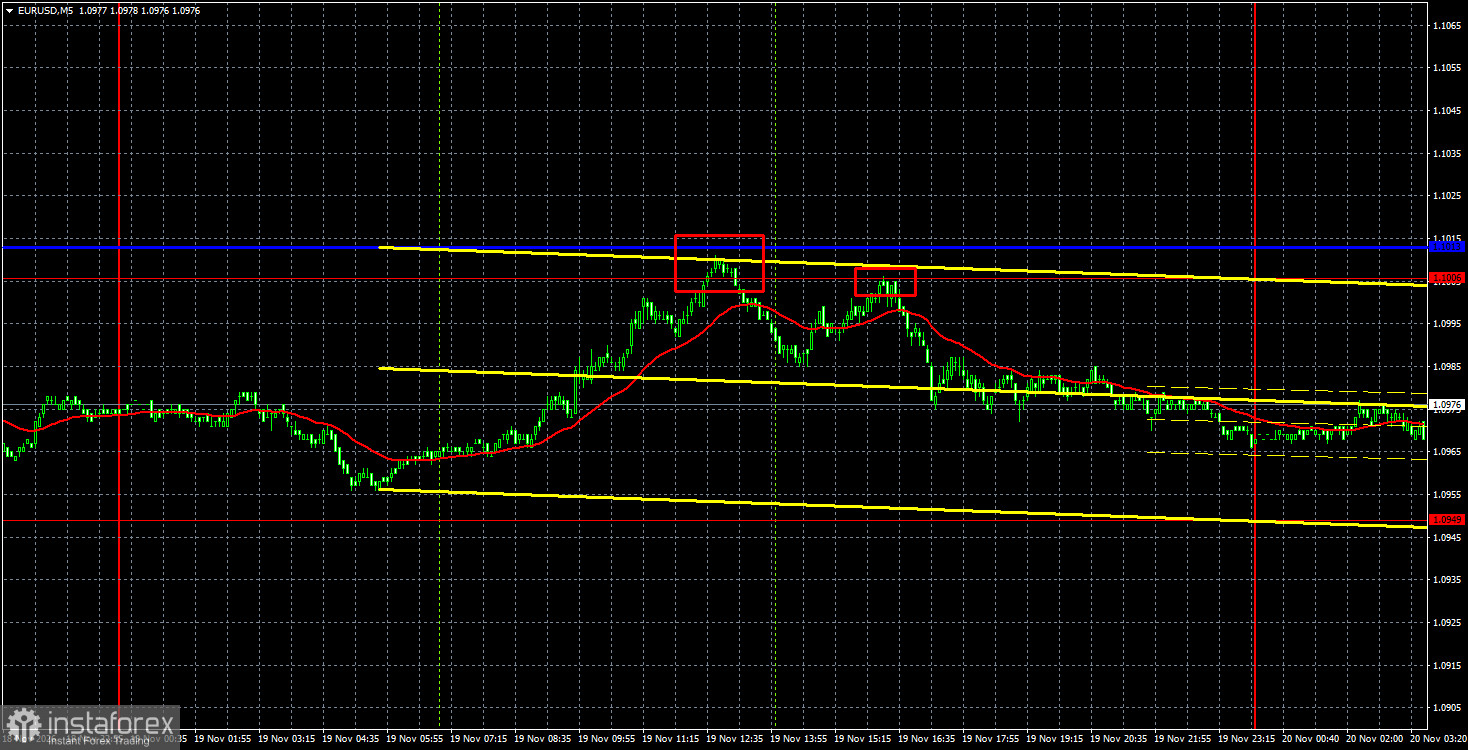
The EUR/USD currency pair avoided a new collapse on Thursday, but it also failed to rise from its knees. Early in the day, the euro showed some signs of life, but by the end of the day it again slid to the bottom. Thus, nothing changed for the single currency on Thursday. No significant events moved either the euro or the dollar. In the U.S., a new round of speeches by Federal Reserve officials reinforced market confidence that the policy rate will rise more than markets expected a month or two ago. In the euro area, European Central Bank President Christine Lagarde spoke for the second time this week. Still, she did not address monetary policy again, and the market continues to ignore all euro-area hawkish rhetoric. There were no notable macro releases. Therefore, the euro avoided another drop on Thursday but offered no new prospects. Recall that a few weeks ago, EUR/USD traded flat for a month and then quietly resumed its decline. Perhaps a similar pause (flat) is occurring now, after which the euro may resume falling.
Technically, the EUR/USD pair left the 1.1115–1.1261 sideways channel and continues an almost free fall, breaking one support level after another. The down move is so strong and relentless that it is impossible even to draw a trendline—there are not two clearly defined price extremes.
On the 5-minute TF, two sell signals formed on Thursday. The price twice bounced off the 1.1006–1.1013 area, allowing traders to open short positions. By the end of the day, the pair fell about 20 pips, which traders could have easily pocketed. Today the euro's decline may well continue.
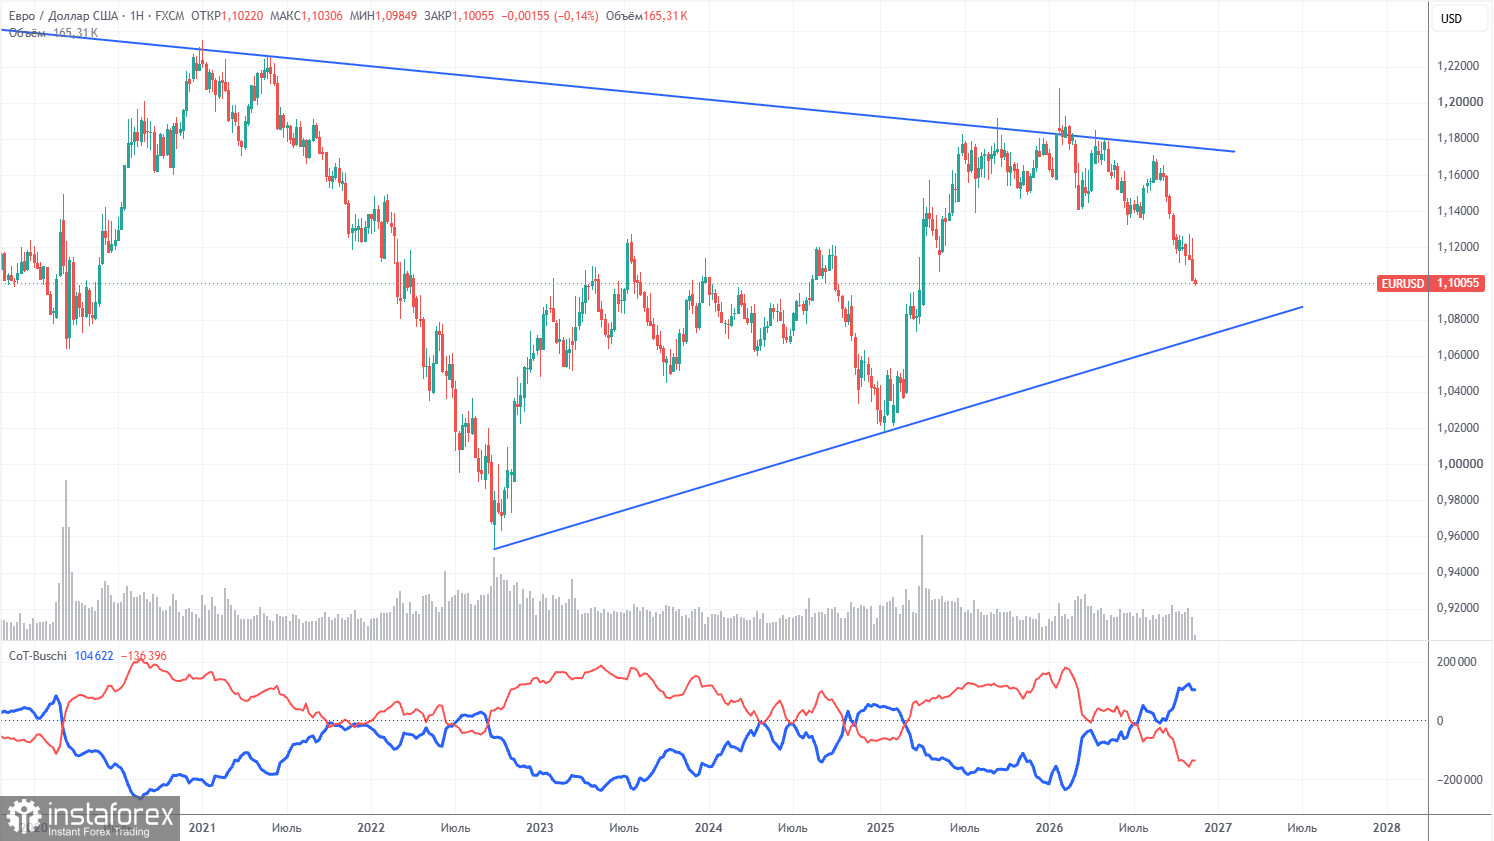
The latest COT report is dated November 10. On the weekly chart, it is clearly visible that non-commercial traders' net position remains bearish and has fallen sharply in 2026 due to geopolitical events and Fed tightening. Traders have been selling the euro in favor of the US dollar over the past nine months. Donald Trump's policy has not changed, which makes long-term dollar strength uncertain.
We still do not see any fundamental factors that would further strengthen the US currency. The war in the Middle East made the dollar temporarily very attractive, and the Fed's monetary stance surprised the dollar for the second time this year. In the long term, the euro could fall to $1.08 (the trend line), but the uptrend will remain relevant. However, in recent months, the market has focused only on positive factors for the dollar and ignored all others.
The positions of the red and blue indicator lines indicate a bears' advantage. During the last reporting week, long positions among the "Non-commercial" group decreased by 1,900 while shorts increased by 23,300. Accordingly, the net position rose by 21,400 contracts.
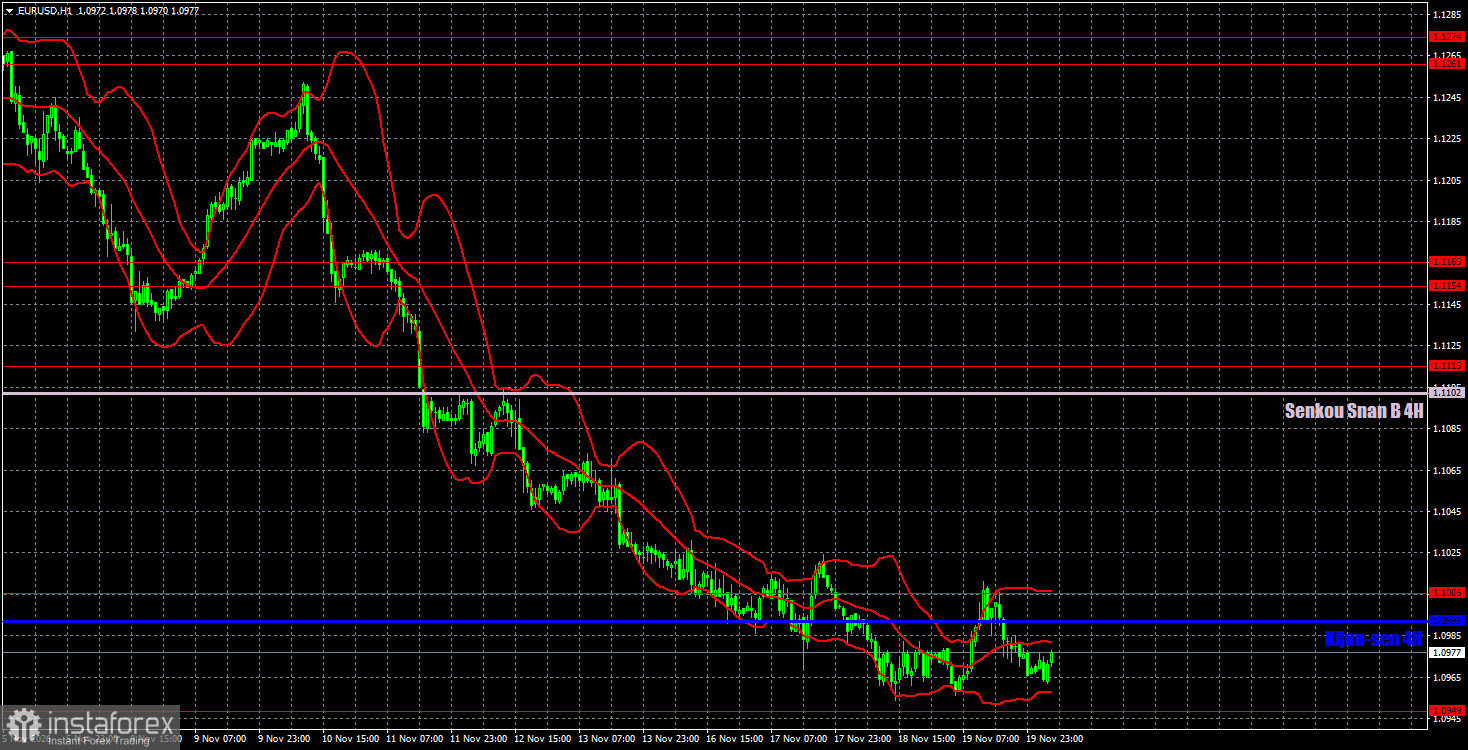
On the hourly timeframe, the EUR/USD pair continues its three-month downtrend without a single significant correction. Over the past three months, the market has shown no willingness to buy the euro, regardless of fundamental, macroeconomic, or geopolitical factors. The euro is in a free fall.
For November 20 we highlight the following levels for trading — 1.0886, 1.0949, 1.1006, 1.1115, 1.1154–1.1165, 1.1261–1.1274, 1.1362–1.1368, 1.1461–1.1473, 1.1536–1.1542, as well as the Ichimoku Senkou Span B line (1.1102) and Kijun-sen (1.0992). The Ichimoku indicator lines may move during the day, so take this into account when determining trading signals. Remember to move your Stop Loss to breakeven if the price has moved 15 pips in the correct direction. This will protect against possible losses if the signal proves false.
On Friday, ECB President Christine Lagarde will speak again, and the University of Michigan consumer-sentiment second-estimate will be published in the U.S. Neither event is likely to affect market sentiment, which continues to sell EUR/USD almost every day.
Traders may consider short positions near 1.0886 if price consolidates below 1.0949 today. On a rebound from 1.0949, traders may consider targets of 1.1006 and 1.1102 for long positions.


