Triple Top
was formed on 04.06 at 04:00:18 (UTC+0)
signal strength 3 of 5
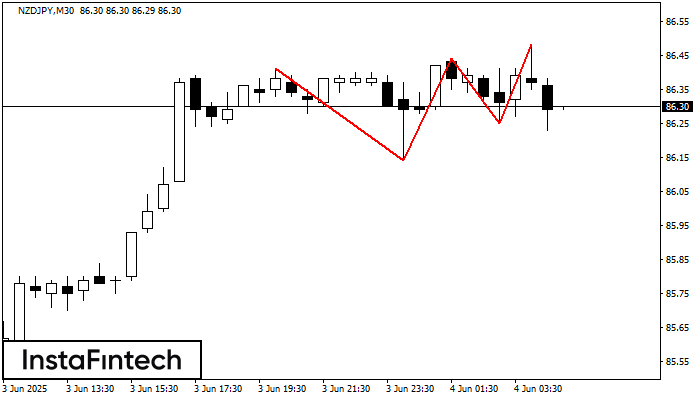
The Triple Top pattern has formed on the chart of the NZDJPY M30 trading instrument. It is a reversal pattern featuring the following characteristics: resistance level -7, support level -11, and pattern’s width 27. Forecast If the price breaks through the support level 86.14, it is likely to move further down to 86.14.
See Also
- All
- All
- Bearish Rectangle
- Bearish Symmetrical Triangle
- Bullish Rectangle
- Double Top
- Double Top
- Triple Bottom
- Triple Bottom
- Triple Top
- Triple Top
- All
- All
- Buy
- Sale
- All
- 1
- 2
- 3
- 4
- 5
Cabeza y Hombros
was formed on 31.07 at 11:06:23 (UTC+0)
signal strength 1 of 5
El patrón técnico llamado Cabeza y Hombros ha aparecido en el gráfico de AUDCHF M5. Existen razones poderosas para sugerir que el precio superará la línea de cuello 0.5247/0.5249 después
Los marcos de tiempo M5 y M15 pueden tener más puntos de entrada falsos.
Open chart in a new window
Cabeza y Hombros Inverso
was formed on 31.07 at 10:55:12 (UTC+0)
signal strength 1 of 5
Según el gráfico de M5, GBPAUD formó el patrón Cabeza y Hombros Inverso. El techo de la Cabeza está establecido en 2.0516 mientras la línea media del Cuello se encuentra
Los marcos de tiempo M5 y M15 pueden tener más puntos de entrada falsos.
Open chart in a new window
Cabeza y Hombros Inverso
was formed on 31.07 at 09:15:06 (UTC+0)
signal strength 1 of 5
Según el gráfico de M5, GBPAUD produjo el patrón llamado el Cabeza y Hombros Inverso. La Cabeza está establecida en 2.0493 mientras la línea media del Cuello se encuentra
Los marcos de tiempo M5 y M15 pueden tener más puntos de entrada falsos.
Open chart in a new window