Bearish Rectangle
was formed on 05.06 at 00:44:55 (UTC+0)
signal strength 1 of 5
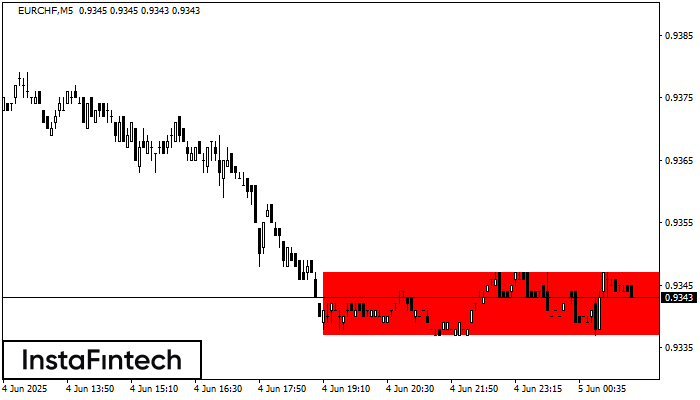
According to the chart of M5, EURCHF formed the Bearish Rectangle. The pattern indicates a trend continuation. The upper border is 0.9347, the lower border is 0.9337. The signal means that a short position should be opened after fixing a price below the lower border 0.9337 of the Bearish Rectangle.
The M5 and M15 time frames may have more false entry points.
See Also
- All
- All
- Bearish Rectangle
- Bearish Symmetrical Triangle
- Bullish Rectangle
- Double Top
- Double Top
- Triple Bottom
- Triple Bottom
- Triple Top
- Triple Top
- All
- All
- Buy
- Sale
- All
- 1
- 2
- 3
- 4
- 5
हेड एण्ड शोल्डर्स
was formed on 14.08 at 07:45:57 (UTC+0)
signal strength 2 of 5
NZDUSD M15 ने निम्न विशेषताओं के साथ हेड एण्ड शोल्डर्स पैटर्न का गठन किया: हेड का टॉप 0.5987 पर है, नेकलाइन और ऊपर का कोण 0.5965/0.5967 पर है। इस पैटर्न
M5 और M15 समय सीमा में अधिक फाल्स एंट्री पॉइंट्स हो सकते हैं।
Open chart in a new window
हेड एण्ड शोल्डर्स
was formed on 14.08 at 07:30:27 (UTC+0)
signal strength 2 of 5
M15 के चार्ट के अनुसार, GBPUSD से हेड एण्ड शोल्डर्स पैटर्न बना। हेड का टॉप 1.3590 पर सेट है जबकि नेक की मध्य रेखा 1.3569/1.3569 पर मौजूद है। हेड एण्ड
M5 और M15 समय सीमा में अधिक फाल्स एंट्री पॉइंट्स हो सकते हैं।
Open chart in a new window
हेड एण्ड शोल्डर्स
was formed on 14.08 at 07:30:17 (UTC+0)
signal strength 3 of 5
M30 के चार्ट के अनुसार, GBPUSD से हेड एण्ड शोल्डर्स पैटर्न बना। हेड का टॉप 1.3590 पर सेट है जबकि नेक की मध्य रेखा 1.3562/1.3569 पर मौजूद है। हेड एण्ड
Open chart in a new window