Vea también

 16.04.2026 08:57 AM
#NDX
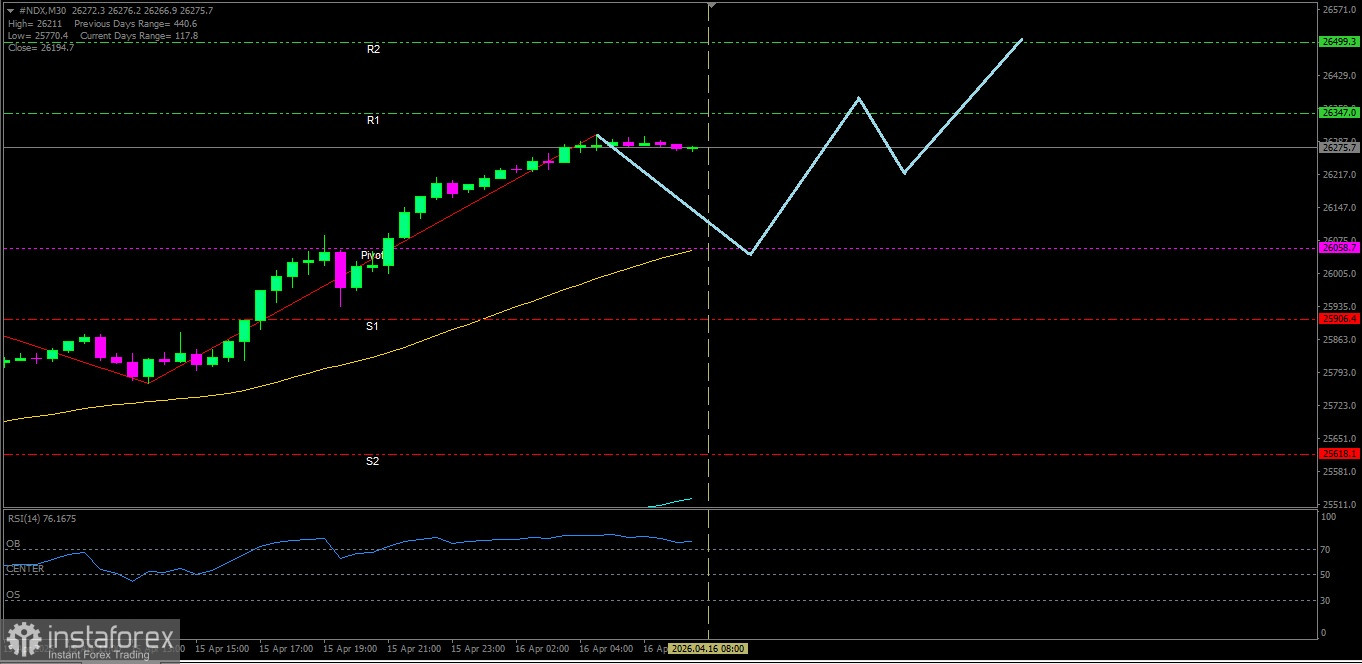
If we Look at the whole #NDX technical indicators which showing strength, and despite the potential for a correction, #NDX has the opportunity today to test its nearest resistance level.
Key Levels
1. Resistance. 2 : 26499.3
2. Resistance. 1 : 26347.0
3. Pivot : 26058.7
4. Support. 1 : 25906.4
5. Support. 2 : 25618.1
Tactical Scenario
Positive Reaction Zone: If #NDX breaks out above 26347.0, there is a likelihood the move will rise toward 26499.3.
Momentum Extension Bias: If 26499.3 is broken, #NDX may test 26787.6.
Invalidation Level / Bias Revision
The upside bias weakens if #NDX breaks down below 25618.1.
Technical Summary
EMA(50) : 26054.4
EMA(200): 25524.0
RSI(14) : 75.74
Economic News Release Agenda:
Today the United States will release the following economic data:
US - Philly Fed Manufacturing Index - 19:30 WIB
US - Unemployment Claims - 19:30 WIB
US - Capacity Utilization Rate - 20:15 WIB
US - Industrial Production m/m - 20:15 WIB
US - Natural Gas Storage - 21:30 WIB
You have already liked this post today
*El análisis de mercado publicado aquí tiene la finalidad de incrementar su conocimiento, más no darle instrucciones para realizar una operación.


