Vea también
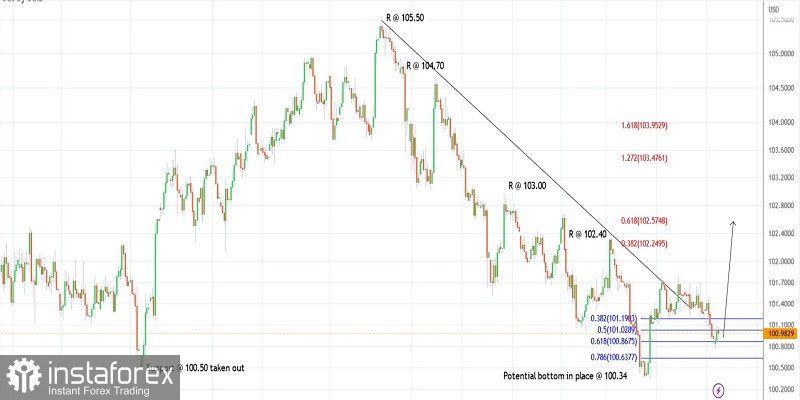
The US dollar index seems to have carved a higher low around 100.80 on Tuesday. The index is seen to be trading close to 101.00 at this point in writing as the bulls are producing a bullish reversal candlestick pattern. Ideally, prices should stay above the 100.34 lows and push higher towards 102.50 and up to 103.70 going forward.
The US dollar index is structurally still unfolding a larger-degree Down Gartley and the bulls are inclined to push through 105.50 to complete the pattern. Please note that the potential remains for a push towards 106.50 and 109.00 before the bears are back in control. Immediate resistance is seen around 103.00 and a break higher will confirm and accelerate a rally.
The US dollar index has carved a lower-degree upswing between 100.34 and 101.78. Furthermore, it completed a corrective drop towards 100.80 in the early hours on Tuesday, which is also the Fibonacci 0.618 retracement of the above rally. If the above structure holds well, prices should resume higher from here and push through 102.50 in the near term.
A potential rally against 100.00
Good luck!
You have already liked this post today
*El análisis de mercado publicado aquí tiene la finalidad de incrementar su conocimiento, más no darle instrucciones para realizar una operación.
El pasado viernes se formaron varios puntos de entrada al mercado. Veamos el gráfico de 5 minutos y analicemos qué ocurrió. En mi pronóstico matutino presté atención al nivel
El pasado viernes solo se formó un punto de entrada al mercado. Veamos el gráfico de 5 minutos y analicemos qué ocurrió allí. En mi pronóstico matutino presté atención
EUR/USD: plan para la sesión europea del 5 de junio. Informes COT (Commitment of Traders) (análisis de las operaciones de ayer). El euro se beneficia de la debilidad del dólar
Ayer se formaron varios puntos de entrada al mercado. Veamos el gráfico de 5 minutos y analicemos lo que ocurrió allí. En mi pronóstico matutino presté atención al nivel
Ayer se formó solo un punto de entrada al mercado. Veamos el gráfico de 5 minutos y analicemos lo que ocurrió allí. En mi pronóstico matutino presté atención al nivel
Ayer se formaron varios puntos de entrada al mercado. Veamos el gráfico de 5 minutos y analicemos que ocurrió. En mi pronóstico matutino presté atención al nivel 1.3555 y planeé
Ayer se formaron varios puntos de entrada al mercado. Veamos el gráfico de 5 minutos y analicemos que ocurrió. En mi pronóstico matutino presté atención al nivel 1.1416 y planeé
GBP/USD: plan para la sesión europea del 2 de junio. Informes COT (Commitment of Traders) (análisis de las operaciones de ayer). La libra no cesa en sus intentos de subir
El pasado viernes se formaron varios puntos de entrada al mercado. Veamos el gráfico de 5 minutos y analicemos lo que ocurrió allí. En mi pronóstico matutino presté atención
cuentas PAMM
InstaForex
Your IP address shows that you are currently located in the USA. If you are a resident of the United States, you are prohibited from using the services of InstaFintech Group including online trading, online transfers, deposit/withdrawal of funds, etc.
If you think you are seeing this message by mistake and your location is not the US, kindly proceed to the website. Otherwise, you must leave the website in order to comply with government restrictions.
Why does your IP address show your location as the USA?
Please confirm whether you are a US resident or not by clicking the relevant button below. If you choose the wrong option, being a US resident, you will not be able to open an account with InstaTrade anyway.
We are sorry for any inconvenience caused by this message.