Vea también
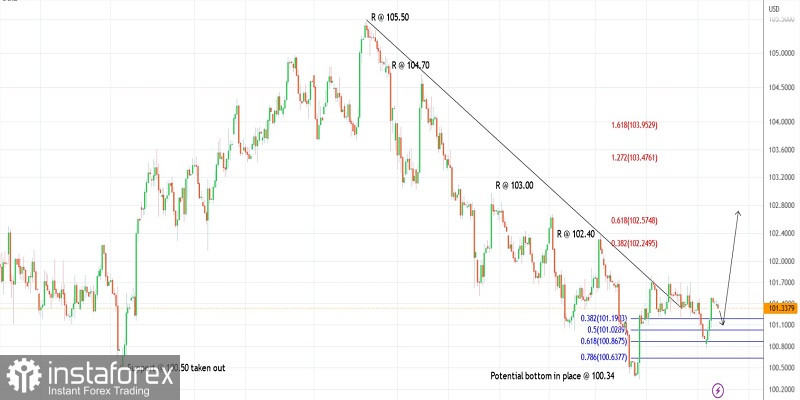
The US dollar index reversed sharply higher after carving a higher low around 100.85 on Tuesday. The index jumped by almost 70 points and approached closely 101.50 before pulling back. It is seen to be trading around 101.30 at this point in writing and is expected to continue its rally further towards 102.50 and up to 105.50 soon.
The US dollar index is on its way to completing the larger-degree Down Gartley corrective rally towards 105.50 and 106.50 respectively. It is now developing its last-leg rally against the 100.34 low, so a break above 103.00 will confirm that the bulls are back in control to push further. Also, note that the potential for the above rally remains up to the 108.00-109.00 zone before the pattern could complete.
The US dollar index remains well supported around 101.00 and a drop there will find the bulls coming back into play. Earlier, the index found support at the Fibonacci 0.618 retracement of the lower-degree upswing (100.34 through 101.80) and bounced higher as seen on the 4H chart. Ideally, prices should now stay above 100.34.
A potential rally against 100.00
Good luck!
You have already liked this post today
*El análisis de mercado publicado aquí tiene la finalidad de incrementar su conocimiento, más no darle instrucciones para realizar una operación.
El pasado viernes se formaron varios puntos de entrada al mercado. Veamos el gráfico de 5 minutos y analicemos qué ocurrió. En mi pronóstico matutino presté atención al nivel
El pasado viernes solo se formó un punto de entrada al mercado. Veamos el gráfico de 5 minutos y analicemos qué ocurrió allí. En mi pronóstico matutino presté atención
EUR/USD: plan para la sesión europea del 5 de junio. Informes COT (Commitment of Traders) (análisis de las operaciones de ayer). El euro se beneficia de la debilidad del dólar
Ayer se formaron varios puntos de entrada al mercado. Veamos el gráfico de 5 minutos y analicemos lo que ocurrió allí. En mi pronóstico matutino presté atención al nivel
Ayer se formó solo un punto de entrada al mercado. Veamos el gráfico de 5 minutos y analicemos lo que ocurrió allí. En mi pronóstico matutino presté atención al nivel
Ayer se formaron varios puntos de entrada al mercado. Veamos el gráfico de 5 minutos y analicemos que ocurrió. En mi pronóstico matutino presté atención al nivel 1.3555 y planeé
Ayer se formaron varios puntos de entrada al mercado. Veamos el gráfico de 5 minutos y analicemos que ocurrió. En mi pronóstico matutino presté atención al nivel 1.1416 y planeé
GBP/USD: plan para la sesión europea del 2 de junio. Informes COT (Commitment of Traders) (análisis de las operaciones de ayer). La libra no cesa en sus intentos de subir
El pasado viernes se formaron varios puntos de entrada al mercado. Veamos el gráfico de 5 minutos y analicemos lo que ocurrió allí. En mi pronóstico matutino presté atención
Notificaciones
por correo electrónico y mensaje de texto
Your IP address shows that you are currently located in the USA. If you are a resident of the United States, you are prohibited from using the services of InstaFintech Group including online trading, online transfers, deposit/withdrawal of funds, etc.
If you think you are seeing this message by mistake and your location is not the US, kindly proceed to the website. Otherwise, you must leave the website in order to comply with government restrictions.
Why does your IP address show your location as the USA?
Please confirm whether you are a US resident or not by clicking the relevant button below. If you choose the wrong option, being a US resident, you will not be able to open an account with InstaTrade anyway.
We are sorry for any inconvenience caused by this message.