Vea también
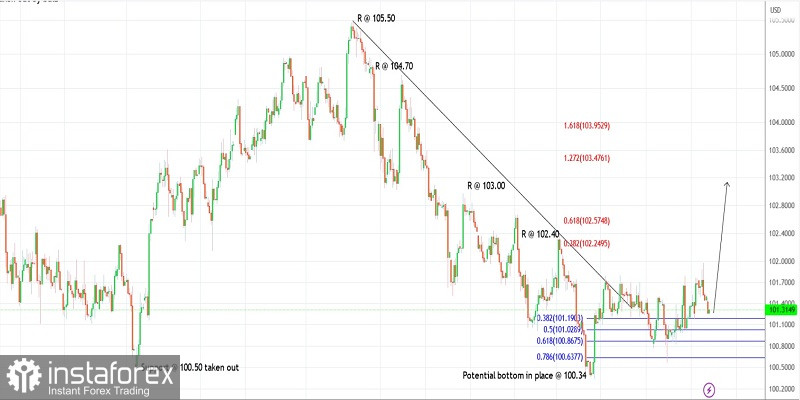
The US dollar index dropped to the 101.25 lows during the early trading hours on Wednesday after hitting a high close to 102.00 on Tuesday. The index is seen to be trading close to 101.30 at this point in writing as the bulls prepare to push the price higher through 102.50 and 104.00 levels in the short term. Ideally, prices should stay above the 100.30 lows to keep the bullish structure intact.
The US dollar index is progressing within the last leg rally of a larger-degree corrective wave, which began from the 100.50 lows earlier. A complex correction is potentially unfolding with a target above 105.50 in the next few weeks. Also, note that the earlier downswing between 114.70 and 100.50 is being retraced and prices could reach up to 108.00 before the bears are back in control.
The US dollar index has further carved a lower-degree upswing between 100.57 and 101.97. The index is currently retracing in the same way and could find support around 100.85 which is also the Fibonacci 0.618 retracement as seen on the chart here. We expect a bullish reaction if prices manage to reach there intraday.
A potential rally against 100.30
Good luck!
You have already liked this post today
*El análisis de mercado publicado aquí tiene la finalidad de incrementar su conocimiento, más no darle instrucciones para realizar una operación.
GBP/USD: plan para la sesión europea del 20 de junio. Informes Commitment of Traders COT (análisis de las operaciones de ayer). La libra reaccionó con una subida tras la decisión
Ayer se formó un punto de entrada al mercado. Veamos el gráfico de 5 minutos y analicemos lo que ocurrió allí. En mi pronóstico matutino presté atención al nivel
GBP/USD: plan para la sesión europea del 19 de junio. Informes Commitment of Traders COT (análisis de las operaciones de ayer). La libra espera la reunión decisiva del Banco
En mi pronóstico matutino presté atención al nivel de 1.1445 y planeé tomar decisiones de entrada al mercado desde ese punto. Veamos el gráfico de 5 minutos y entendamos
Ayer solo se formó un punto de entrada al mercado. Veamos el gráfico de 5 minutos y analicemos lo que sucedió. En mi pronóstico matutino presté atención al nivel
Ayer solo se formó un punto de entrada al mercado. Propongo echar un vistazo al gráfico de 5 minutos y analizar lo sucedido. En mi pronóstico matutino presté atención
Ayer se formaron varios excelentes puntos de entrada al mercado. Veamos el gráfico de 5 minutos y analicemos lo que ocurrió. En mi pronóstico matutino presté atención al nivel 1.3536
EUR/USD: plan para la sesión europea del 13 de junio. Informes Commitment of Traders COT (análisis de las operaciones de ayer). El euro cayó bruscamente tras los ataques de Israel
El pasado viernes se formaron varios puntos de entrada al mercado. Veamos el gráfico de 5 minutos y analicemos qué ocurrió. En mi pronóstico matutino presté atención al nivel
El pasado viernes solo se formó un punto de entrada al mercado. Veamos el gráfico de 5 minutos y analicemos qué ocurrió allí. En mi pronóstico matutino presté atención
Your IP address shows that you are currently located in the USA. If you are a resident of the United States, you are prohibited from using the services of InstaFintech Group including online trading, online transfers, deposit/withdrawal of funds, etc.
If you think you are seeing this message by mistake and your location is not the US, kindly proceed to the website. Otherwise, you must leave the website in order to comply with government restrictions.
Why does your IP address show your location as the USA?
Please confirm whether you are a US resident or not by clicking the relevant button below. If you choose the wrong option, being a US resident, you will not be able to open an account with InstaTrade anyway.
We are sorry for any inconvenience caused by this message.