Vea también
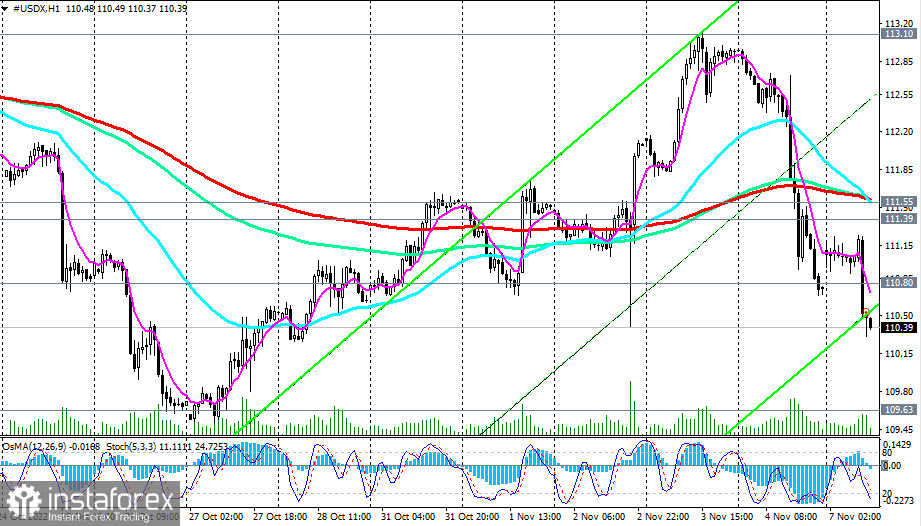
At the beginning of today's European trading session, the dollar is falling again, and the DXY dollar index has again moved into the "red" zone, dropping below Friday's low of 110.61 to 110.31 as of writing.
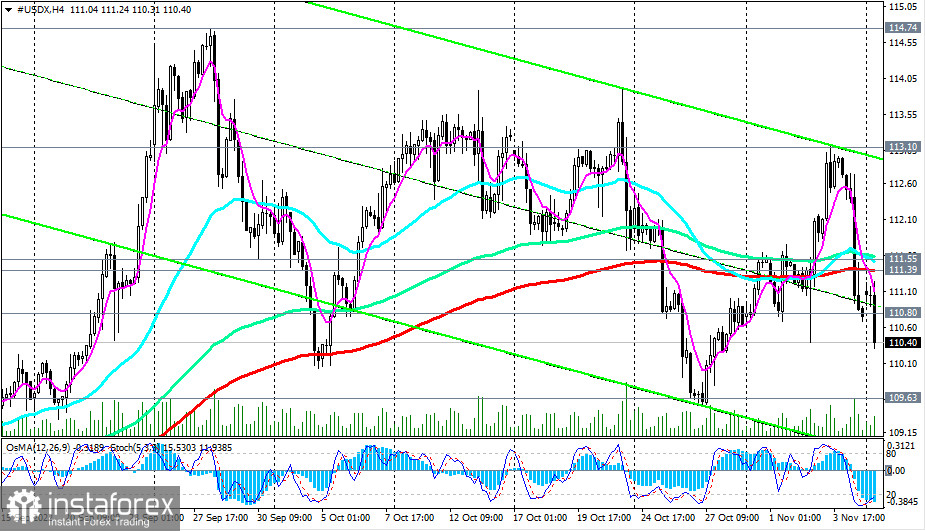
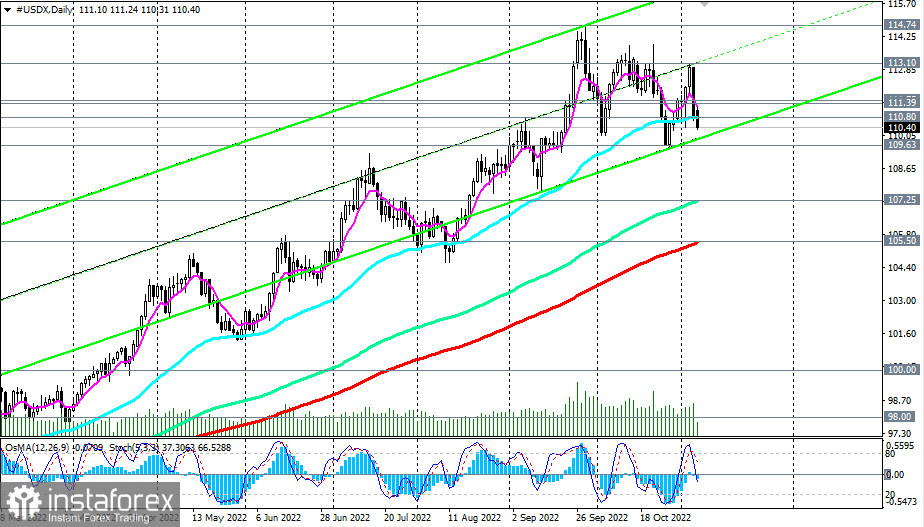
On Friday, the sellers managed to push the price below important support levels 111.55 (200 EMA on the 1-hour chart), 111.39 (200 EMA on the 4-hour chart), 110.80 (50 EMA on the daily chart).
The nearest support lies at the levels of 109.63, 109.00. Their breakdown will strengthen the negative dynamics of the dollar and CFD #USDX, sending it towards the key support levels 107.25 (144 EMA on the daily chart), 105.50 (200 EMA on the daily chart). But above them, the #USDX CFD remains in the long-term bull market zone. Therefore, when bullish drivers appear, dollar buyers will quickly take control of the situation again.
In turn, the growth of CFD #USDX in the area above the resistance level 111.55 will be the first signal to resume long positions.
Support levels: 109.63, 109.00, 107.25, 105.50
Resistance levels: 110.80, 111.39, 111.55, 113.10, 114.00, 114.74, 115.00
Trading Tips
Sell Stop 110.20. Stop Loss 110.90. Take Profit 109.70, 109.00, 107.25, 105.50
Buy Stop 110.90. Stop-Loss 110.20. Take-Profit 111.40, 111.55, 113.10, 114.00, 114.74, 115.00
You have already liked this post today
*El análisis de mercado publicado aquí tiene la finalidad de incrementar su conocimiento, más no darle instrucciones para realizar una operación.
Ayer se formaron varios excelentes puntos de entrada al mercado. Veamos el gráfico de 5 minutos y analicemos lo que ocurrió. En mi pronóstico matutino presté atención al nivel 1.3536
EUR/USD: plan para la sesión europea del 13 de junio. Informes Commitment of Traders COT (análisis de las operaciones de ayer). El euro cayó bruscamente tras los ataques de Israel
El pasado viernes se formaron varios puntos de entrada al mercado. Veamos el gráfico de 5 minutos y analicemos qué ocurrió. En mi pronóstico matutino presté atención al nivel
El pasado viernes solo se formó un punto de entrada al mercado. Veamos el gráfico de 5 minutos y analicemos qué ocurrió allí. En mi pronóstico matutino presté atención
EUR/USD: plan para la sesión europea del 5 de junio. Informes COT (Commitment of Traders) (análisis de las operaciones de ayer). El euro se beneficia de la debilidad del dólar
Ayer se formaron varios puntos de entrada al mercado. Veamos el gráfico de 5 minutos y analicemos lo que ocurrió allí. En mi pronóstico matutino presté atención al nivel
Ayer se formó solo un punto de entrada al mercado. Veamos el gráfico de 5 minutos y analicemos lo que ocurrió allí. En mi pronóstico matutino presté atención al nivel
Ayer se formaron varios puntos de entrada al mercado. Veamos el gráfico de 5 minutos y analicemos que ocurrió. En mi pronóstico matutino presté atención al nivel 1.3555 y planeé
Ayer se formaron varios puntos de entrada al mercado. Veamos el gráfico de 5 minutos y analicemos que ocurrió. En mi pronóstico matutino presté atención al nivel 1.1416 y planeé
Gráfico Forex
versión web
Your IP address shows that you are currently located in the USA. If you are a resident of the United States, you are prohibited from using the services of InstaFintech Group including online trading, online transfers, deposit/withdrawal of funds, etc.
If you think you are seeing this message by mistake and your location is not the US, kindly proceed to the website. Otherwise, you must leave the website in order to comply with government restrictions.
Why does your IP address show your location as the USA?
Please confirm whether you are a US resident or not by clicking the relevant button below. If you choose the wrong option, being a US resident, you will not be able to open an account with InstaTrade anyway.
We are sorry for any inconvenience caused by this message.