Vea también

 29.02.2024 02:44 AM
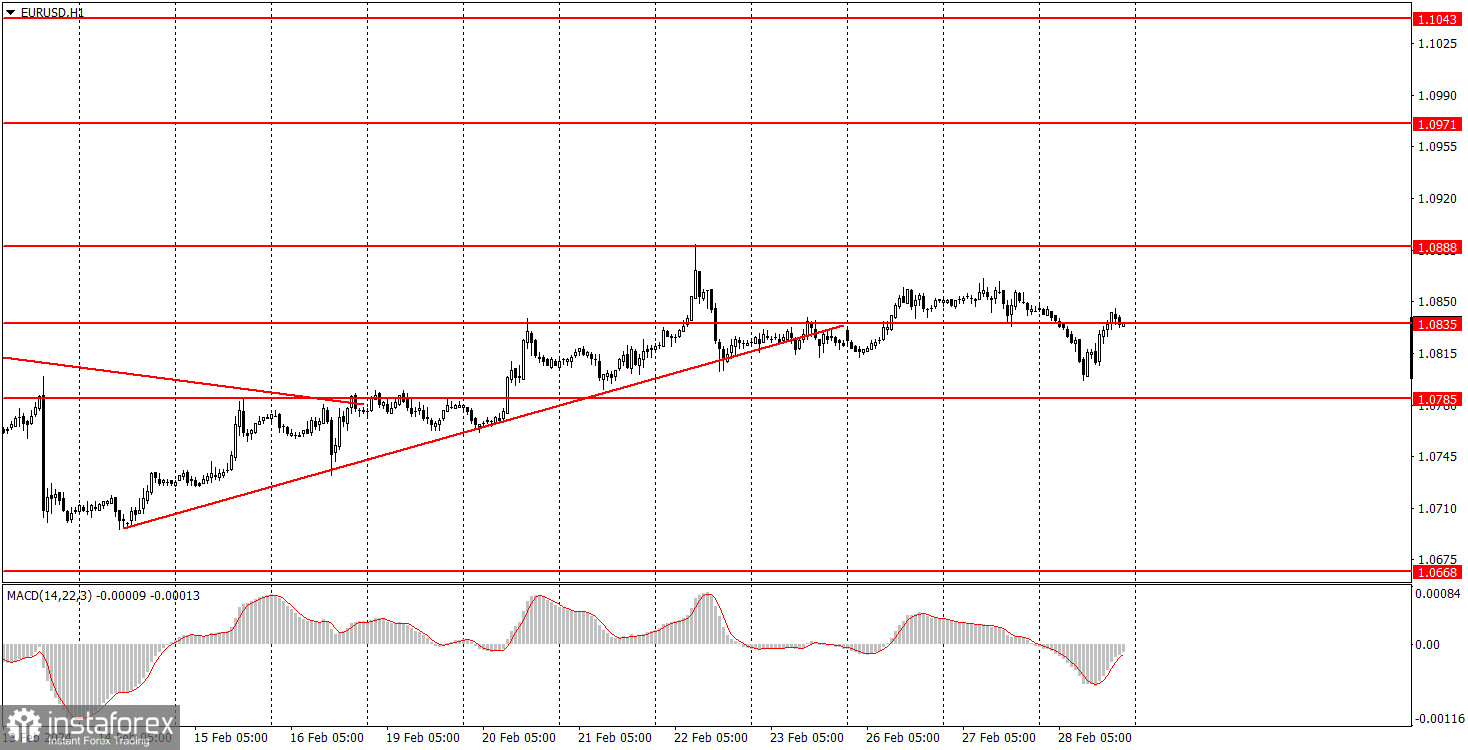
EUR/USD tried to start a new downtrend on Wednesday, but it was unsuccessful. Unfortunately, Wednesday's report did not support the US dollar. Although the market could have ignored it, as it was hardly crucial. The second estimate of GDP in the United States for the fourth quarter turned out to be slightly lower than the market expected and forecasted. Frankly, we don't understand why dollar buyers were so disappointed with this value and retreated. In any case, we still have the final estimate that will put an end to the question of US economic growth. But the dollar still failed to rise further due to this report.
Nevertheless, we still expect a new decline from the euro. The pair has breached the trendline, and there are no fundamental reasons for the euro's growth. Theoretically, EUR/USD may correct higher, but the upward movement has already stalled.
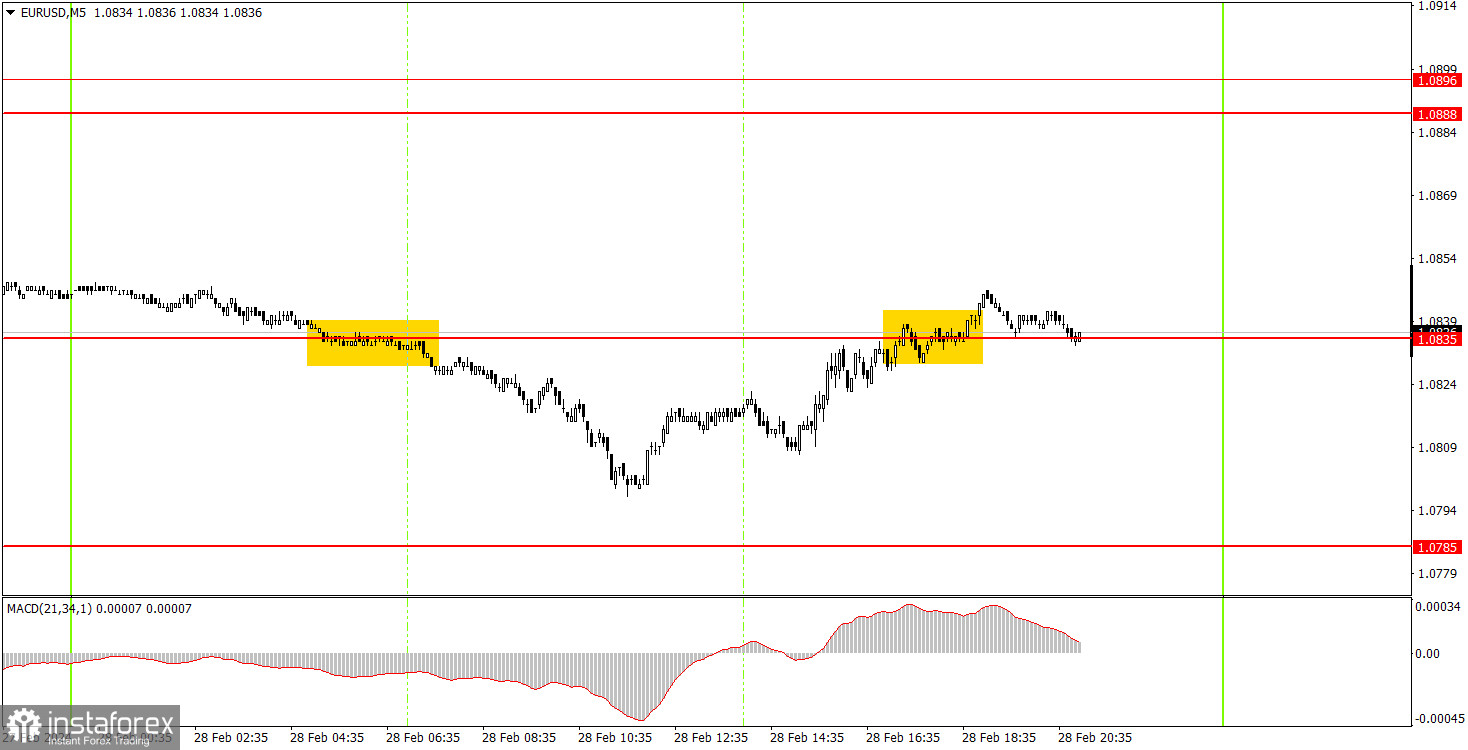
Two trading signals were generated on the 5-minute timeframe. At the beginning of the European trading session, the pair consolidated below the level of 1.0835, after which it managed to fall by about 25 pips. The price could not reach the target level, so the trade closed at breakeven due to the Stop Loss. Unfortunately, volatility was low again. The second buy signal near the same level neither brought profit nor loss, as the movement after its breakthrough ended.
On the hourly chart, EUR/USD may continue to correct higher for some time, although there are still no macroeconomic and fundamental reasons to support the euro's growth. We still expect a decline from the euro, and in our opinion, it should continue for quite a long time. There are no clear technical sell signals at the moment, but the trendline is no longer relevant. We believe that it is more likely for the pair to fall this week.
The key levels on the 5M chart are 1.0568, 1.0611-1.0618, 1.0668, 1.0725, 1.0767-1.0785, 1.0835, 1.0888-1.0896, 1.0940, 1.0971-1.0981, 1.1011, 1.1043, 1.1091. On Thursday, Germany will release an important report on inflation for February, as well as secondary data on unemployment and retail sales. The US will release reports on initial jobless claims, personal income and spending, and the Personal Consumption Expenditures (PCE) Price Index. All these reports may have an impact on market sentiment.
1) Signal strength is determined by the time taken for its formation (either a bounce or level breach). A shorter formation time indicates a stronger signal.
2) If two or more trades around a certain level are initiated based on false signals, subsequent signals from that level should be disregarded.
3) In a flat market, any currency pair can produce multiple false signals or none at all. In any case, the flat trend is not the best condition for trading.
4) Trading activities are confined between the onset of the European session and mid-way through the U.S. session, after which all open trades should be manually closed.
5) On the 30-minute timeframe, trades based on MACD signals are only advisable amidst substantial volatility and an established trend, confirmed either by a trendline or trend channel.
6) If two levels lie closely together (ranging from 5 to 15 pips apart), they should be considered as a support or resistance zone.
Support and Resistance price levels can serve as targets when buying or selling. You can place Take Profit levels near them.
Red lines represent channels or trend lines, depicting the current market trend and indicating the preferable trading direction.
The MACD(14,22,3) indicator, encompassing both the histogram and signal line, acts as an auxiliary tool and can also be used as a signal source.
Significant speeches and reports (always noted in the news calendar) can profoundly influence the price dynamics. Hence, trading during their release calls for heightened caution. It may be reasonable to exit the market to prevent abrupt price reversals against the prevailing trend.
Beginning traders should always remember that not every trade will yield profit. Establishing a clear strategy coupled with sound money management is the cornerstone of sustained trading success.


