Vea también

 14.04.2026 06:25 AM
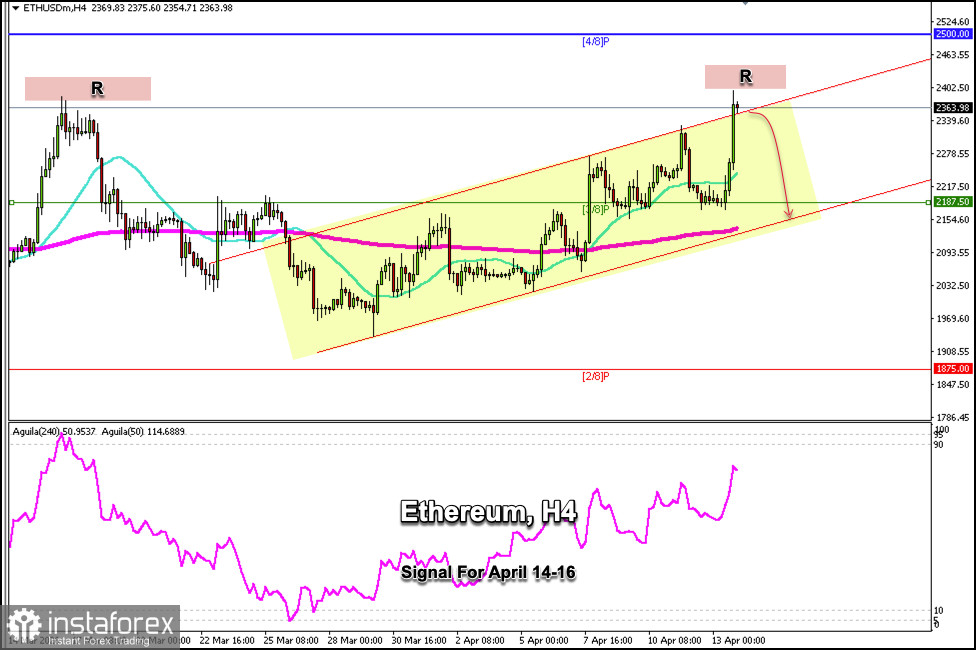
Ethereum (ETH/USD) is trading around $2,363, showing a strong upward trend after finding solid support near the 3/8 Murray line. This upward momentum helped Ethereum reach its March 14 high of around $2,400.
According to the H4 chart, we can see that ETH could continue its rise in the coming hours and even in the coming days until it reaches the psychological level of $2,500. This level could offer strong resistance. Below this zone, we could expect a technical correction.
If Ethereum falls below $2,350 and the price re-enters below the bullish trend channel, we could see a technical correction toward the 200 EMA or around $2,150.
The outlook remains positive for Ethereum, and we expect any pullback to be seen as a buying opportunity in the coming days. If the price reaches the 21 SMA around $2,220, we could view this zone as a point for a technical bounce and open long positions with a target at $2,500.
In case the price falls below the 200 EMA around $2,150 and breaks decisively out of the uptrend channel formed since March 28, we could expect a sharp technical correction that could push the price down to the 2/8 Murray level around $1,875.
Our trading plan for the coming hours is to sell ETH/USD below $2,363, with a target at $2,187. The Eagle indicator is reaching overbought levels, and we foresee a technical correction in the coming days.
You have already liked this post today
*El análisis de mercado publicado aquí tiene la finalidad de incrementar su conocimiento, más no darle instrucciones para realizar una operación.


