Vea también

 16.04.2026 03:57 PM
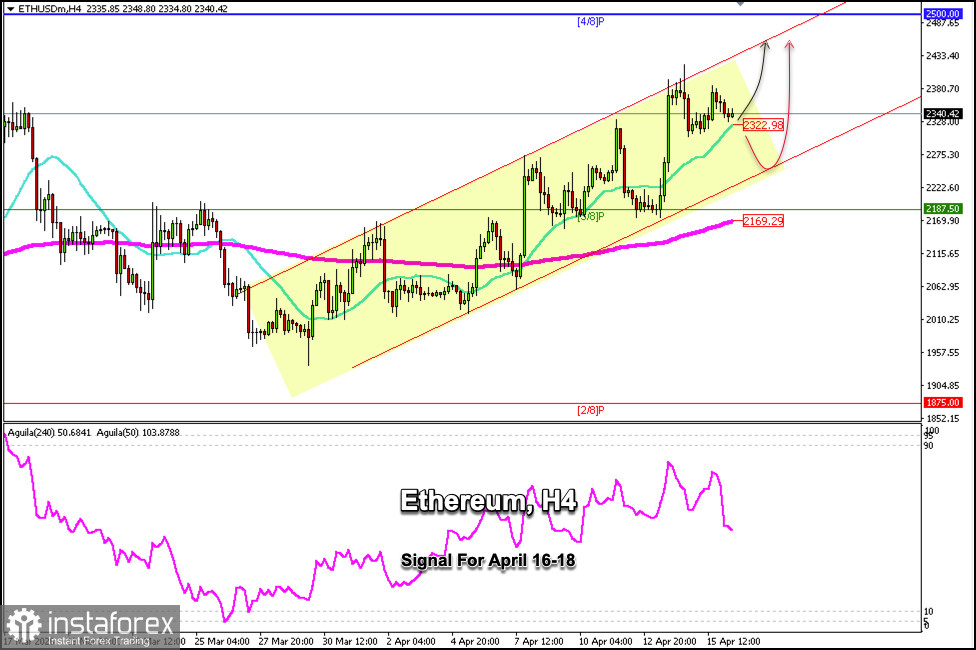
Ethereum (ETH/USD) is trading around $2,340 above the 21-day SMA and showing signs of waning bullish momentum. After three failed attempts to break above the $2,400 level, Ethereum is undergoing a technical correction and could find solid support around $2,300.
If bearish momentum prevails and Ethereum consolidates below the 21 SMA, we could expect it to continue its downtrend and undergo a technical correction until finding support around the lower band of the uptrend channel at $2,220.
A technical rebound around the lower band of the uptrend channel could be seen as an opportunity to open long positions. The price will reach the psychological level of $2,500 around the 4/8 Murray line in the coming days.
Only a decisive break below the bullish trend channel and a consolidation below the 3/8 Murray line—and in turn below the 200 EMA at $2,169—could signal a shift in the ETH/USD trend, potentially entering a bearish phase that could drive prices down toward the 2/8 Murray line at $1,875.
Given that the Eagle indicator is showing overbought signals, we could expect a technical correction toward $2,200 to open long positions. Otherwise, we could look for opportunities to open short positions from current price levels below $2,400.
You have already liked this post today
*El análisis de mercado publicado aquí tiene la finalidad de incrementar su conocimiento, más no darle instrucciones para realizar una operación.


