Vea también

 10.04.2025 06:49 AM
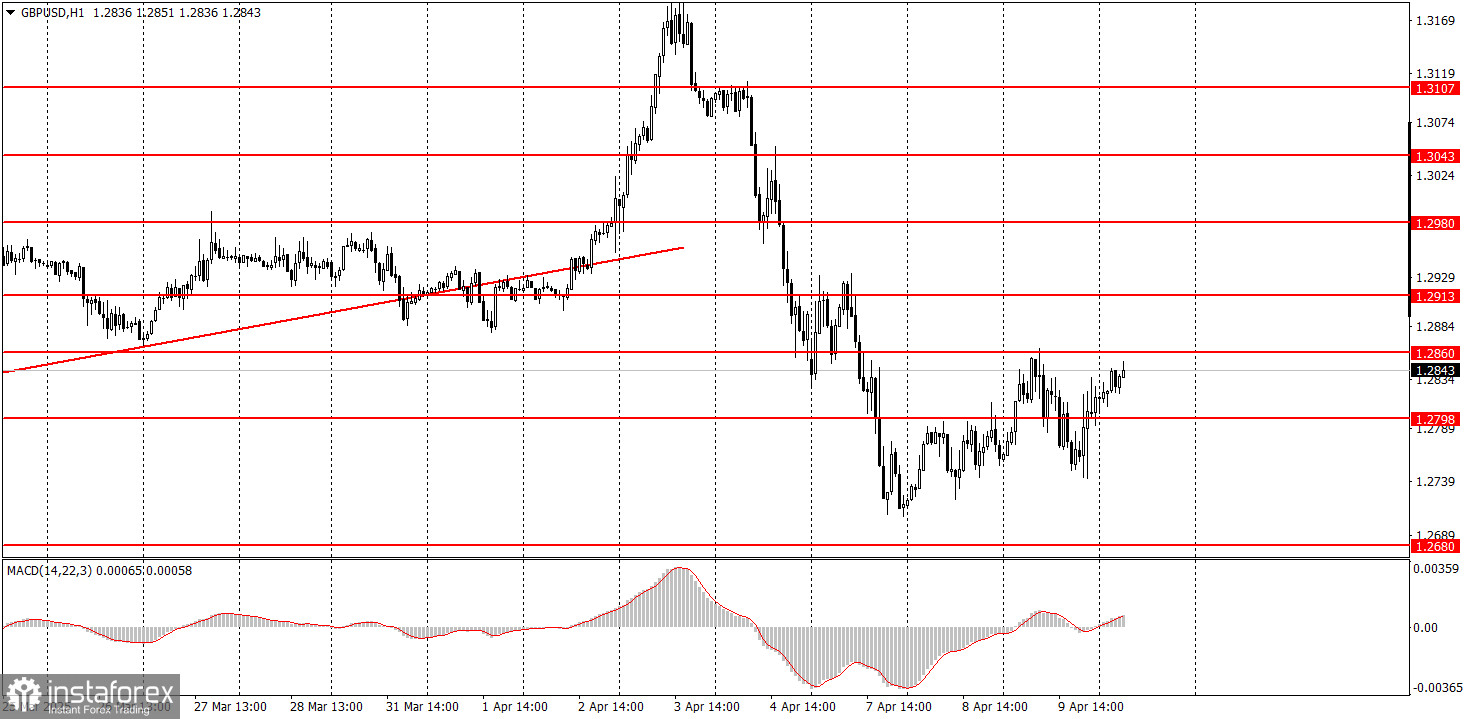
The GBP/USD pair spent the past 24 hours rising, then falling again, and then rising again. As before, it's impossible to identify a clear trend on the hourly timeframe. News about the progress of the trade war is released every hour or two, market sentiment shifts constantly, and the pair is being thrown back and forth. The pound is rising at the moment, but it could be falling again in an hour.
Donald Trump's grace period changes virtually nothing. Sure, three months can be used for negotiations to avoid a full-scale trade conflict with many countries. However, the key trading partners are Mexico, Canada, the EU, China, Japan, and South Korea. So far, there's no realistic chance of reaching an amicable agreement with Canada, the EU, or China. And in any case, "reciprocal tariffs" remain in effect—just now at 10%. Therefore, the dollar has gained no strong new reasons to rally over the past day.
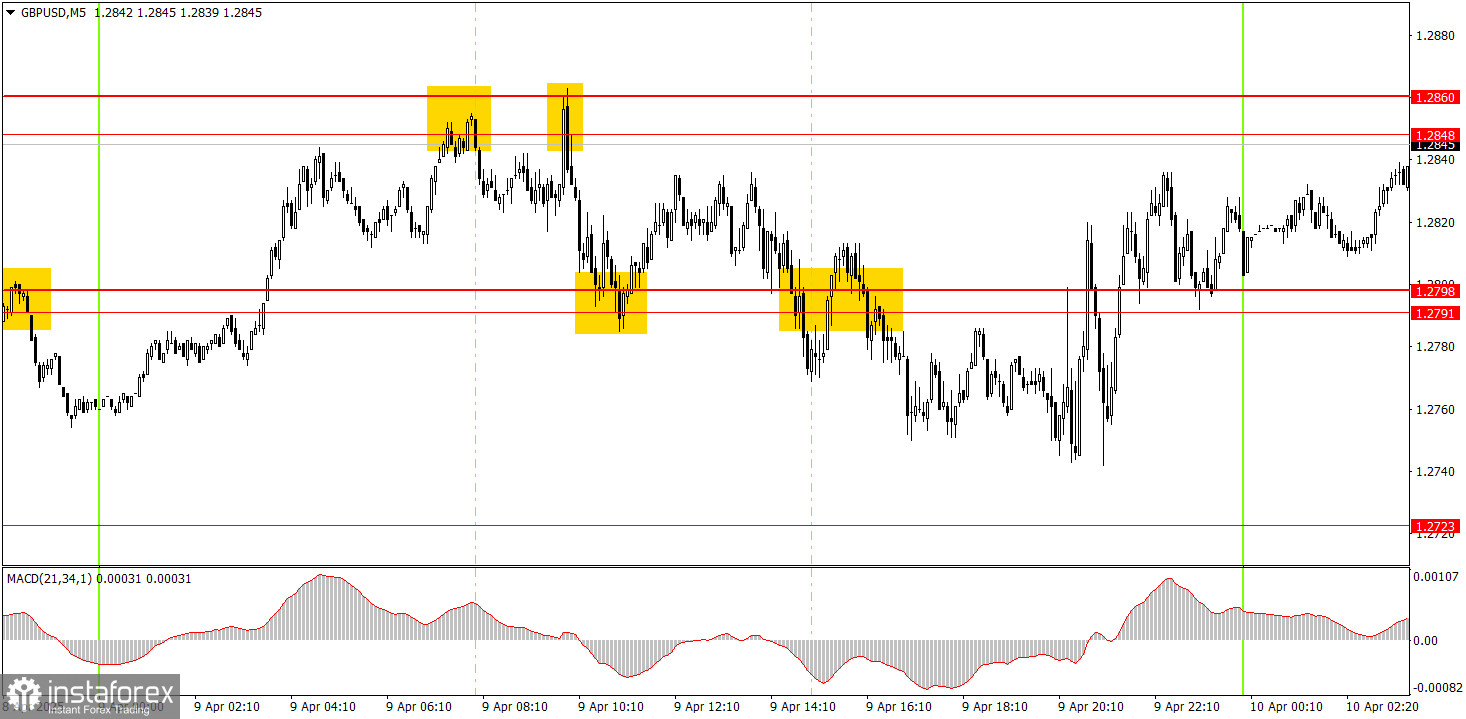
On the 5-minute timeframe, several signals were formed on Wednesday. However, as noted, market sentiment kept shifting, and the price frequently reversed direction. The first two sell signals in the 1.2848–1.2860 area could be traded confidently. The next signal of the 1.2791–1.2798 zone was also valid. Then the U.S. session opened, Trump woke up, and chaos resumed.
In the hourly timeframe, the GBP/USD pair should have started a downward trend long ago, but Trump has kept doing everything he can to push the dollar down. Since the official start of the global trade war, we don't attempt to predict long-term price movements. Last Friday, we saw a sharp drop in the pair, which may be the beginning of a deeper correction. Still, the market remains under the influence of Trump and his decisions: Trump announces new tariffs – the dollar falls; Trump offers discounts – and the dollar bounces.
On Thursday, GBP/USD may remain in turmoil. Predicting the pound and dollar's direction today is nearly impossible. At this point, the pair is rising naturally, and today's U.S. inflation report could also impact price movements.
On the 5-minute chart, trading is currently possible around the following levels: 1.2502–1.2508, 1.2547, 1.2613, 1.2680–1.2685, 1.2723, 1.2791–1.2798, 1.2848–1.2860, 1.2913, 1.2980–1.2993, 1.3043, 1.3102–1.3107, 1.3145–1.3167, 1.3225, 1.3272.
No significant events are scheduled in the UK on Thursday, but the U.S. inflation report will be released. While not as crucial as it once was, it shouldn't be ignored.
Support and Resistance Levels: These are target levels for opening or closing positions and can also serve as points for placing Take Profit orders.
Red Lines: Channels or trendlines indicating the current trend and the preferred direction for trading.
MACD Indicator (14,22,3): A histogram and signal line used as a supplementary source of trading signals.
Important Events and Reports: Found in the economic calendar, these can heavily influence price movements. Exercise caution or exit the market during their release to avoid sharp reversals.
Forex trading beginners should remember that not every trade will be profitable. Developing a clear strategy and practicing proper money management are essential for long-term trading success.


