Vea también

 01.05.2025 06:42 PM
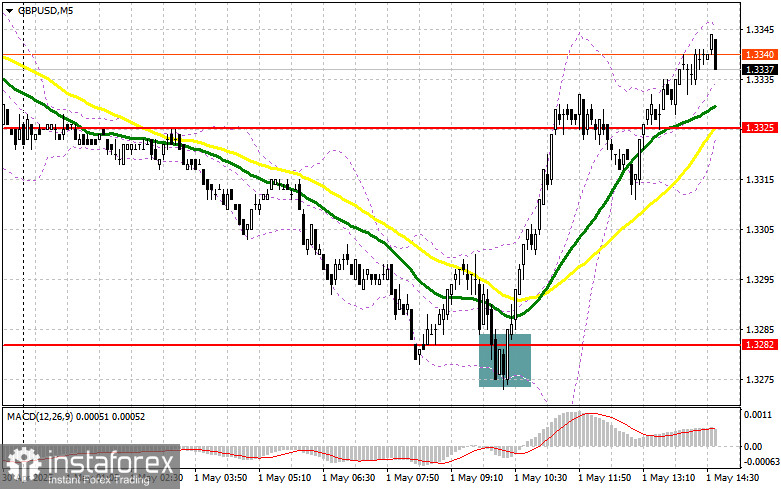
In my morning forecast, I focused on the 1.3282 level and planned to make entry decisions based on it. Let's take a look at the 5-minute chart and see what happened. A decline followed by a false breakout around the 1.3282 level led to a great entry point for long positions, resulting in a sharp rise to the target level of 1.3325. The technical picture was revised for the second half of the day.
To open long positions on GBP/USD:
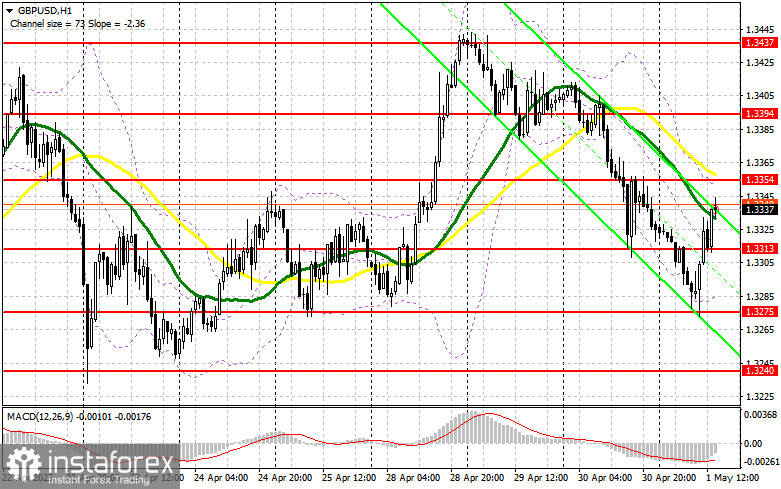
Good UK lending data supported the British pound in the first half of the day, helping to restore hopes of halting the bearish market seen in recent days. However, everything could change during the U.S. session as buyers will have to contend with American statistics. Figures on initial jobless claims and the ISM Manufacturing Index for April are expected. Strong readings would put pressure back on the pound. In that case, I expect the first buyer activity to appear around the new support level at 1.3313, formed in the first half of the day. A false breakout there will provide a good entry point for long positions aiming to recover toward the resistance at 1.3354. A breakout and retest of this range from above will give a new entry point for long positions with the prospect of updating 1.3394 — which would reestablish a bullish market. The ultimate target will be the 1.3437 level, where I plan to take profit. If GBP/USD declines and there is no buyer activity around 1.3313 in the second half of the day, pressure on the pound will return with renewed force. In this case, only a false breakout around 1.3275 would serve as a proper condition for opening long positions. Otherwise, I plan to buy GBP/USD on a rebound from 1.3240, targeting a 30–35 point intraday correction.
To open short positions on GBP/USD:
Sellers attempted to assert themselves but failed to hold near the daily lows. If GBP/USD makes another move upward following weak U.S. data, I plan to act after a false breakout forms around the 1.3354 resistance, where the moving averages currently sit — favoring sellers. This will provide an entry point for selling with a target of a decline to support at 1.3313. A breakout and retest of this range from below will trigger stop-losses and open the path toward 1.3275 — the weekly low. The furthest target will be the 1.3240 level, where I plan to take profit. If demand for the pound remains strong in the second half of the day and bears fail to show any activity around 1.3354, it would be better to delay selling until testing resistance at 1.3394. I will only open short positions there after a false breakout. If there is no downward movement there either, I will look for shorts from 1.3437, but only with the goal of a 30–35 point intraday correction.
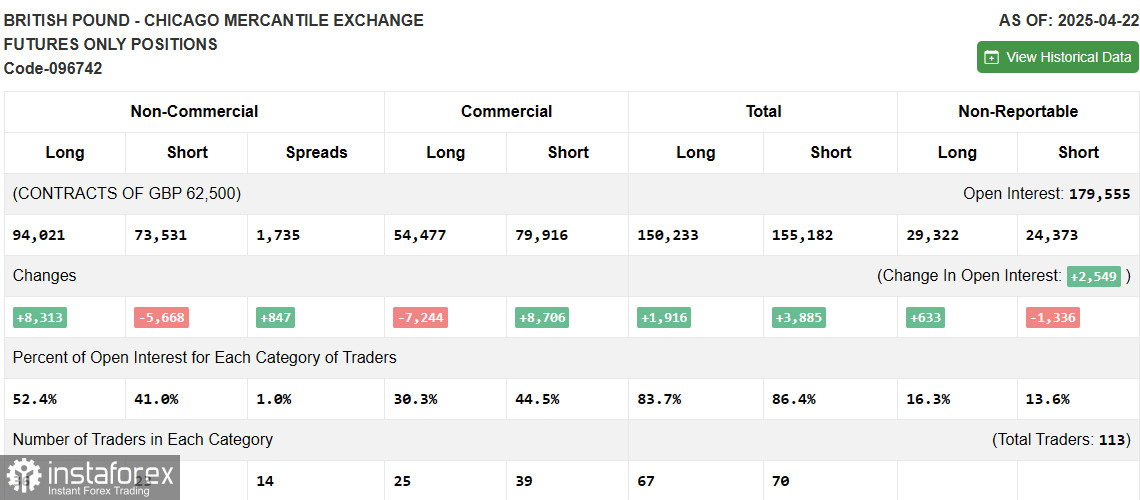
The COT (Commitment of Traders) report from April 22 showed an increase in long positions and a decrease in short ones. Given that the Bank of England is not planning to cut interest rates further for now, this continues to support the pound and allows it to strengthen against the U.S. dollar. However, a trade deal compromise between the U.S. and China is having a restraining effect and is also helping to maintain demand for the U.S. dollar. In the near term, the key data will be U.S. Q1 GDP figures and April labor market statistics. The latest COT report showed that long non-commercial positions rose by 8,313 to 94,021, while short non-commercial positions fell by 5,668 to 73,531. As a result, the gap between long and short positions increased by 847.
Indicator Signals:
Moving Averages
Trading is taking place below the 30- and 50-day moving averages, indicating a continued decline in the pound.
Note: The moving average periods and prices are based on the author's settings on the H1 chart and differ from standard daily moving averages on the D1 chart.
Bollinger Bands
In the event of a decline, the lower band of the indicator around 1.3290 will act as support.
Indicator Descriptions: • Moving Average – defines the current trend by smoothing out volatility and noise. Period – 50 (marked in yellow on the chart); • Moving Average – defines the current trend by smoothing out volatility and noise. Period – 30 (marked in green on the chart); • MACD Indicator (Moving Average Convergence/Divergence) – Fast EMA: period 12; Slow EMA: period 26; SMA: period 9; • Bollinger Bands – volatility bands around a 20-period moving average; • Non-commercial traders – speculators such as individual traders, hedge funds, and large institutions who use the futures market for speculative purposes and meet specific requirements; • Long non-commercial positions – the total long open positions of non-commercial traders; • Short non-commercial positions – the total short open positions of non-commercial traders; • Net non-commercial position – the difference between non-commercial short and long positions.


